← All visual stories
Unequal carbon footprints
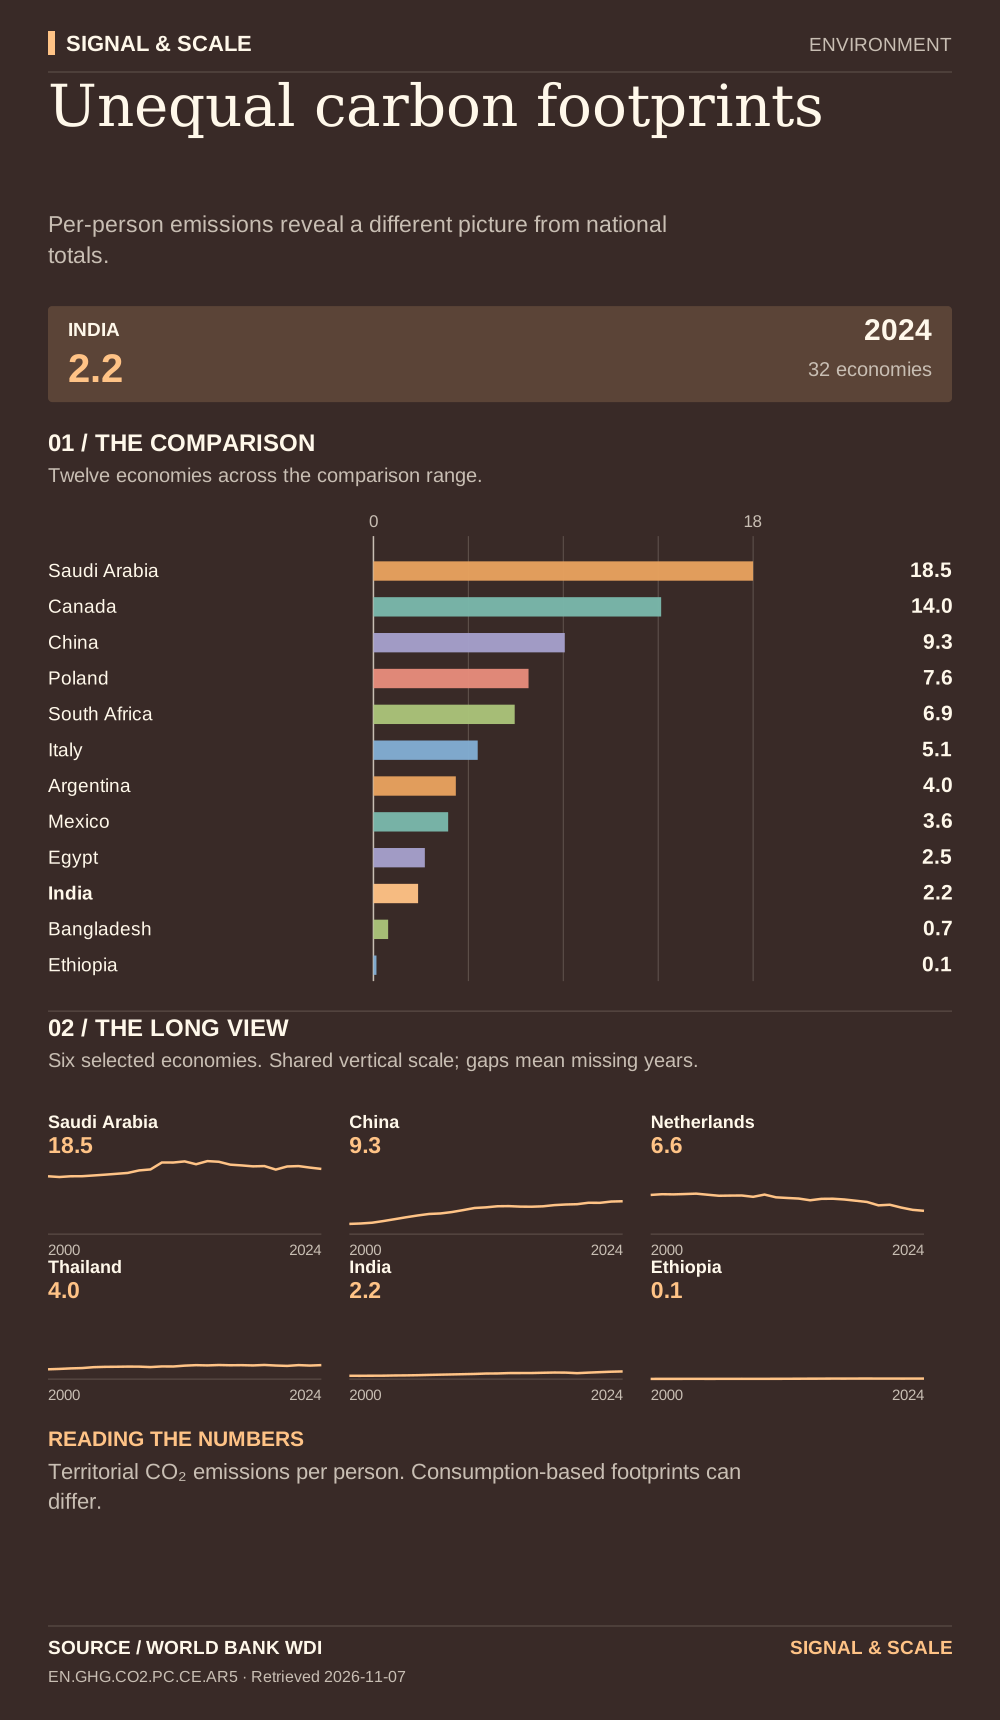
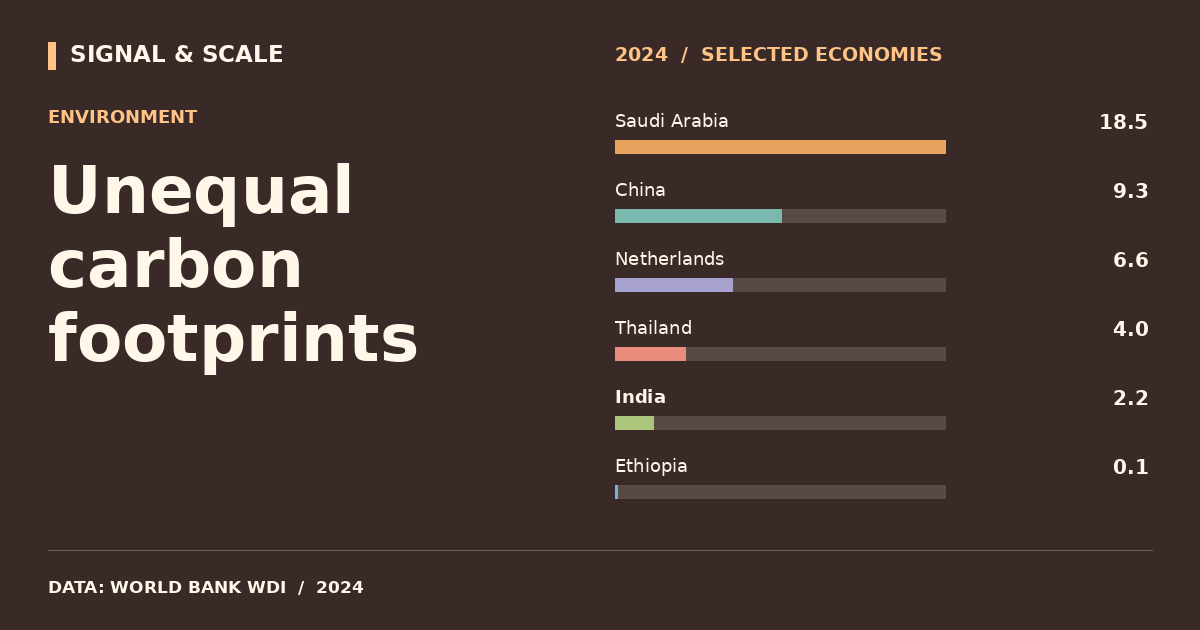
Per-person emissions reveal a different picture from national totals.

Explore, download and share
THE STORY BEHIND THE CHART
The story behind the numbers
Territorial emissions per resident compare average carbon output across populations of very different sizes. They reflect the domestic energy and industrial system. They do not assign emissions embodied in imports to the final consumer, and national averages conceal differences within a country.
THE TAKEAWAY
Per-person emissions reveal a different picture from national totals.
Read the numbers carefully
Territorial CO₂ emissions per person. Consumption-based footprints can differ.
Data behind the visual
This selected comparison includes 32 economies with observations in 2024 shown in tonnes CO₂/person.
| Country | Value |
|---|---|
| Saudi Arabia | 18.48 t |
| United Arab Emirates | 18.26 t |
| Australia | 14.1 t |
| Canada | 14.01 t |
| United States | 13.62 t |
| South Korea | 11.36 t |
| China | 9.32 t |
| Japan | 7.84 t |
| Poland | 7.55 t |
| Norway | 7.18 t |
| Germany | 6.94 t |
| South Africa | 6.88 t |
| Netherlands | 6.6 t |
| Türkiye | 5.38 t |
| Italy | 5.08 t |
| Vietnam | 4.27 t |
| United Kingdom | 4.22 t |
| Argentina | 4.01 t |
| France | 4 t |
| Thailand | 3.96 t |
| Mexico | 3.64 t |
| Sweden | 3.57 t |
| Indonesia | 2.87 t |
| Egypt | 2.5 t |
| Brazil | 2.32 t |
| India | 2.17 t |
| Philippines | 1.5 t |
| Pakistan | 0.81 t |
| Bangladesh | 0.72 t |
| Nigeria | 0.57 t |
| Kenya | 0.38 t |
| Ethiopia | 0.15 t |
EXPLORE THE DATA
Compare any two countries.
Choose two places to inspect this indicator side-by-side. Same source, same year.
VS