THE BIG PICTURE DEMOGRAPHY
India’s fertility rate fell by two-thirds
Sixty-five years of national estimates show a steep decline. Two rounds of household surveys reveal how uneven the shift has been across states.
Read the visual story ↗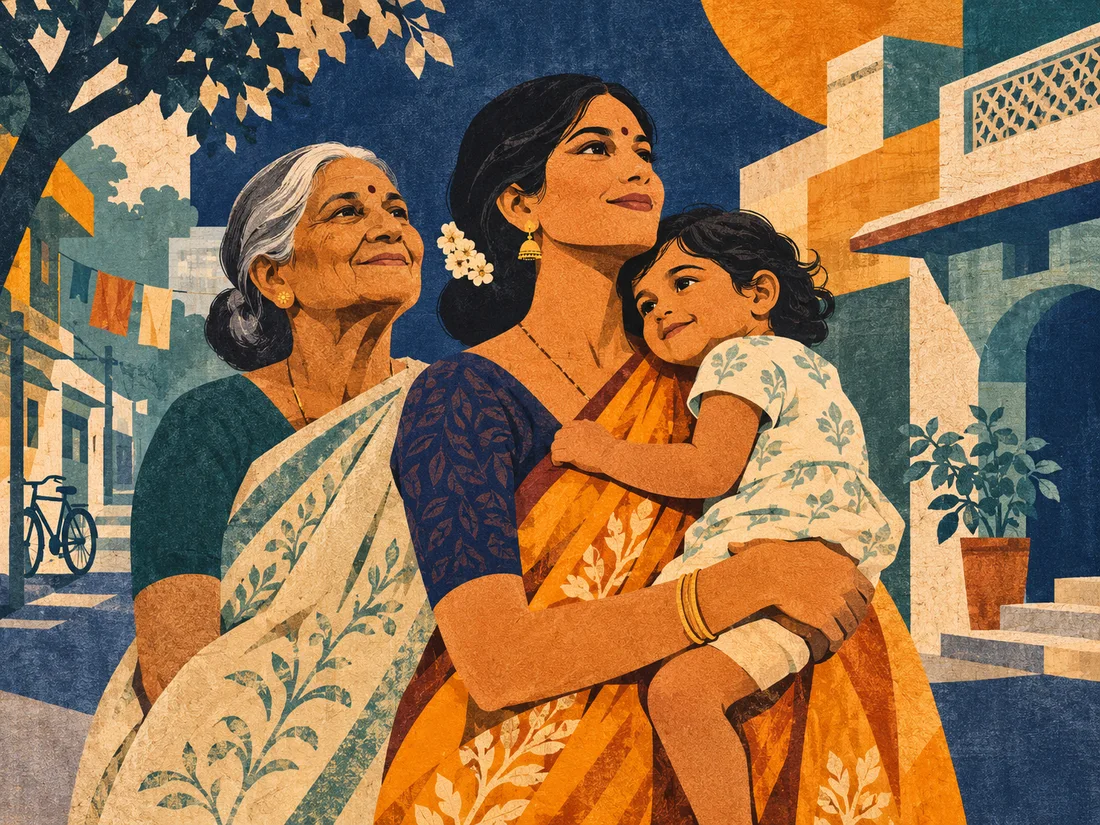 5 of 36states and territories above 2.1 in the 2019–21 survey
The chart library.
Explore 30 visual stories with country comparisons, historical trends and downloadable data.
Showing 12 of 30 visual stories
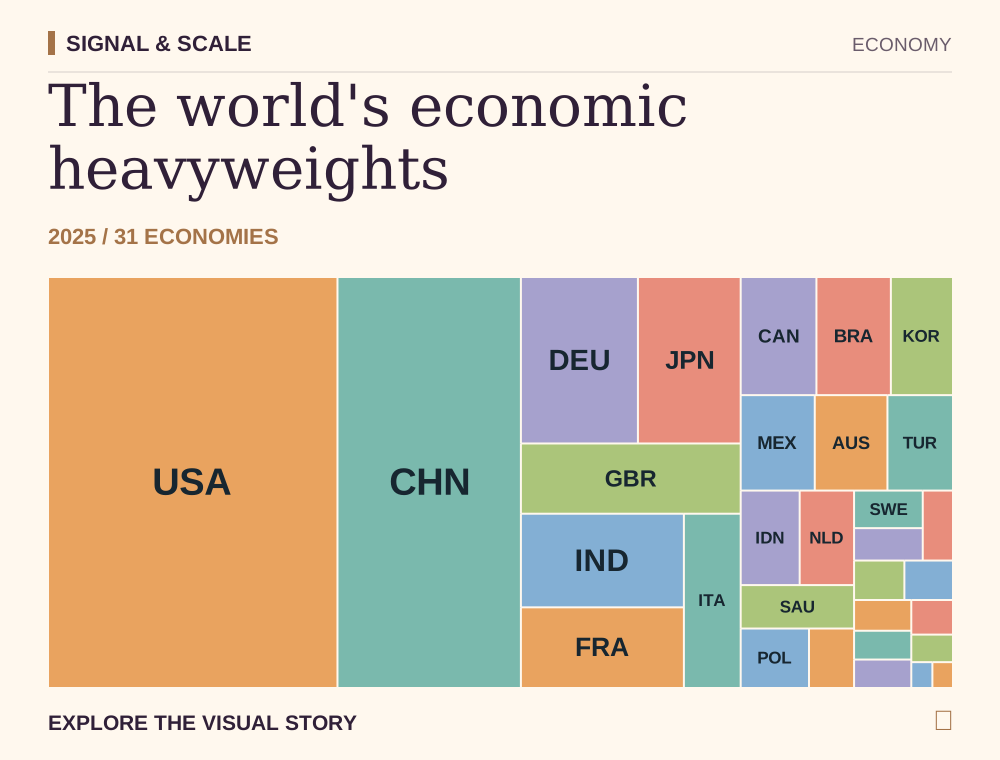
The world's economic heavyweights
The size of an economy is only one way to measure its influence.
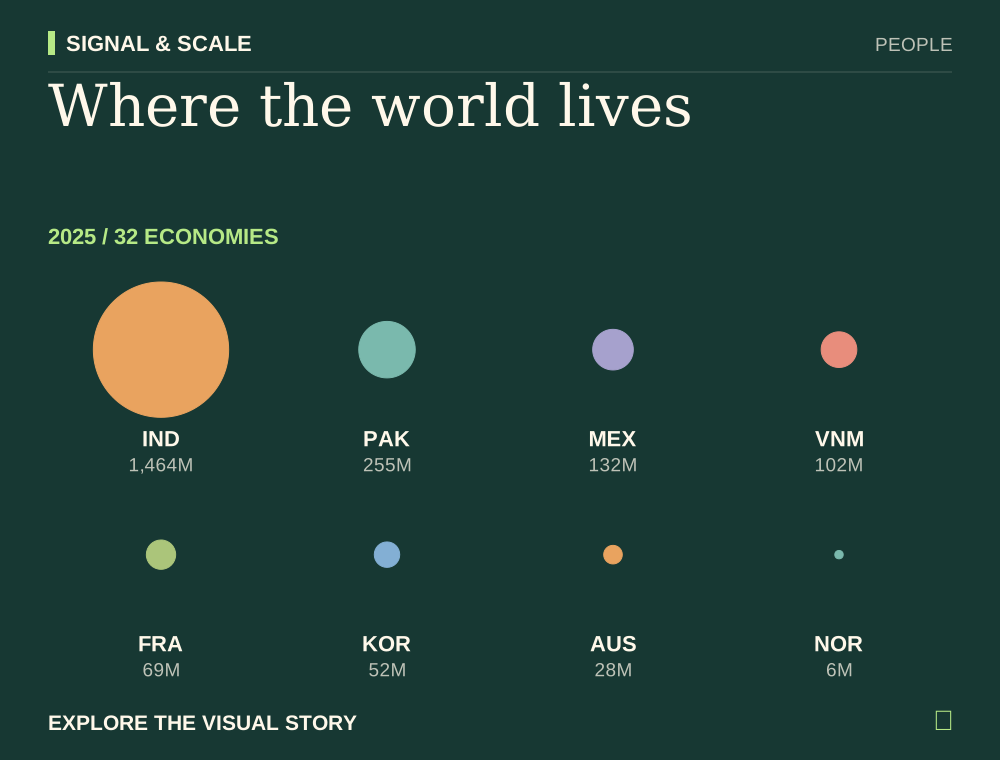
Where the world lives
A few populous countries shape the global demographic picture.
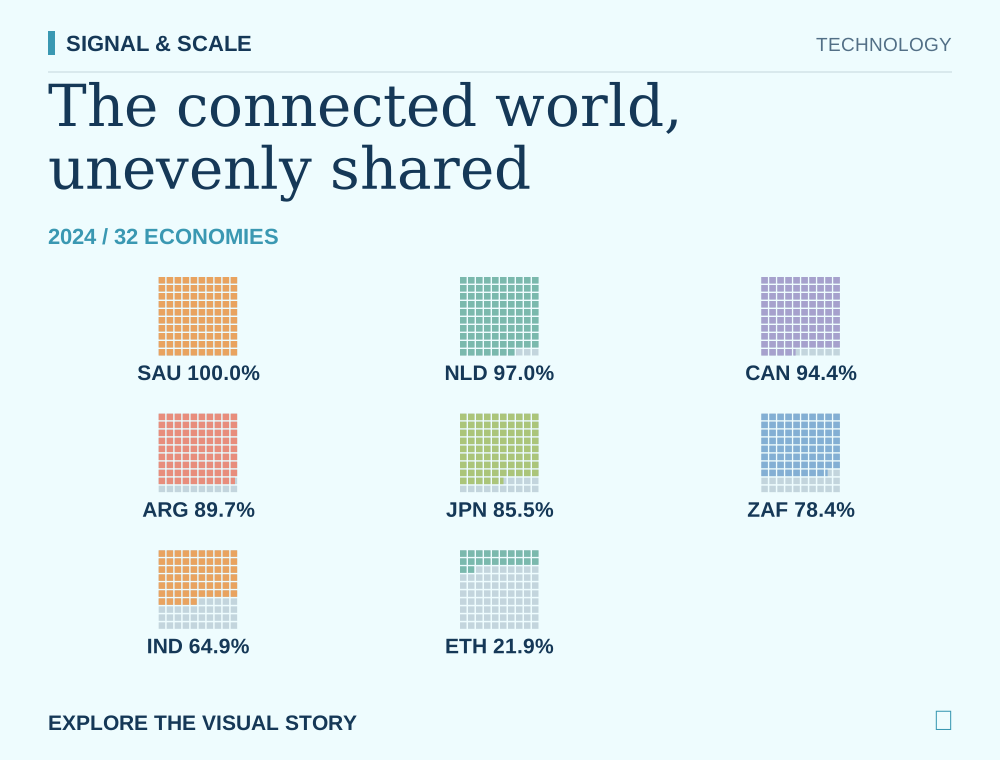
The connected world, unevenly shared
Internet access has expanded, but the gap remains visible.
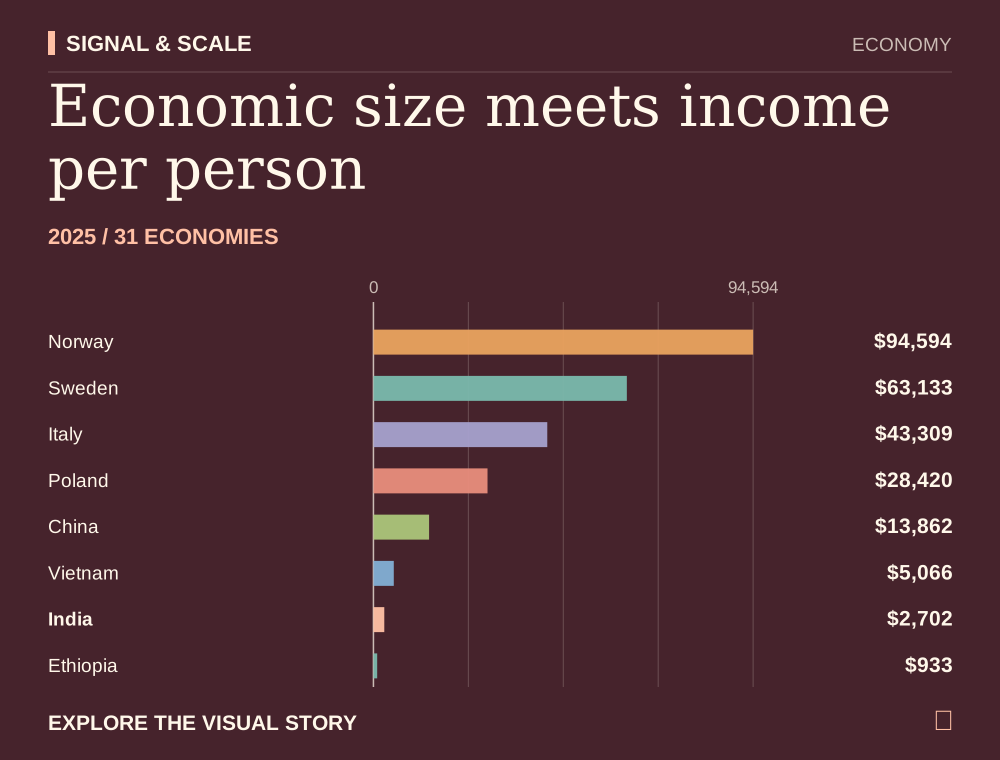
Economic size meets income per person
Large economies can still have modest output per resident.
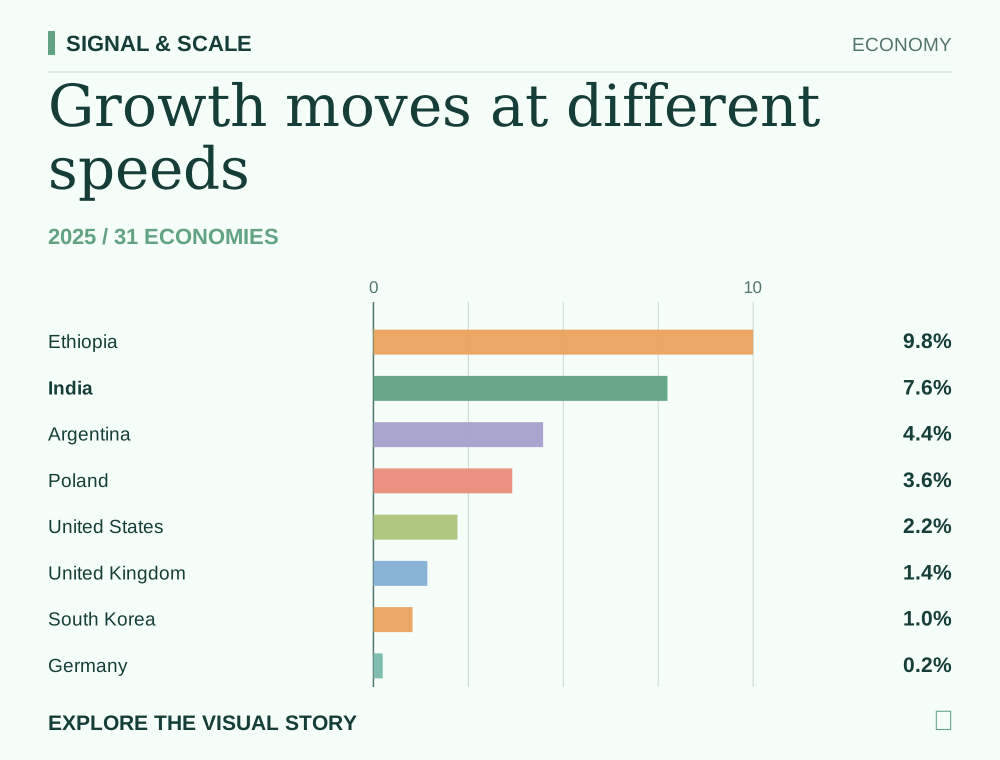
Growth moves at different speeds
A common baseline separates expansion from contraction.
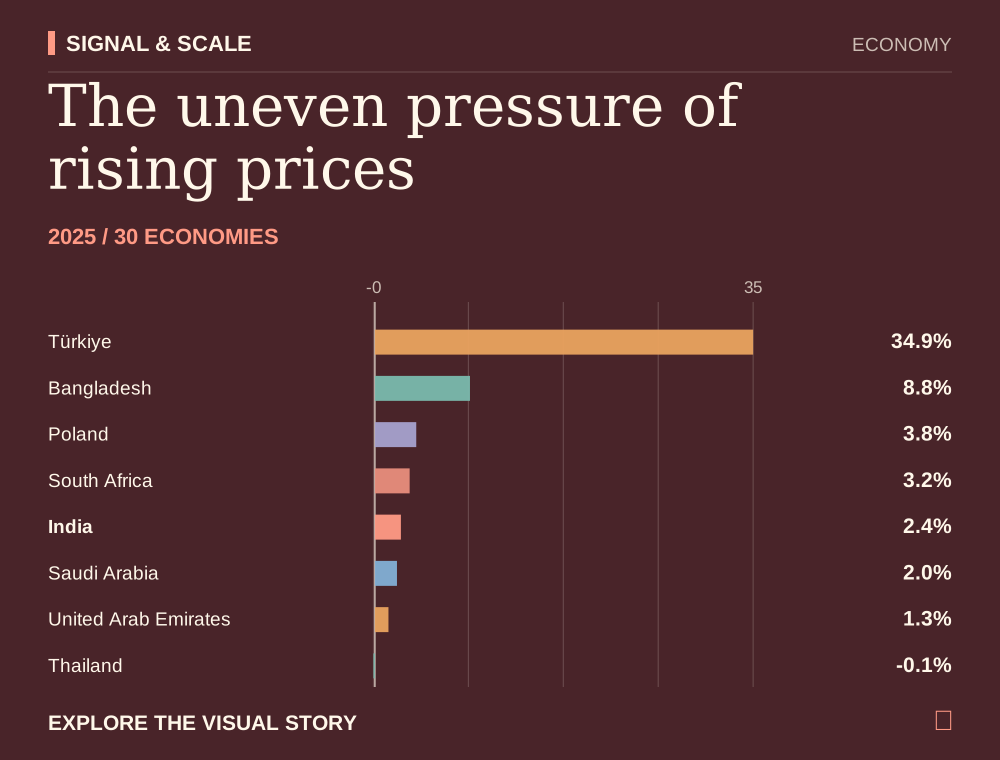
The uneven pressure of rising prices
The same year can bring very different changes in living costs.
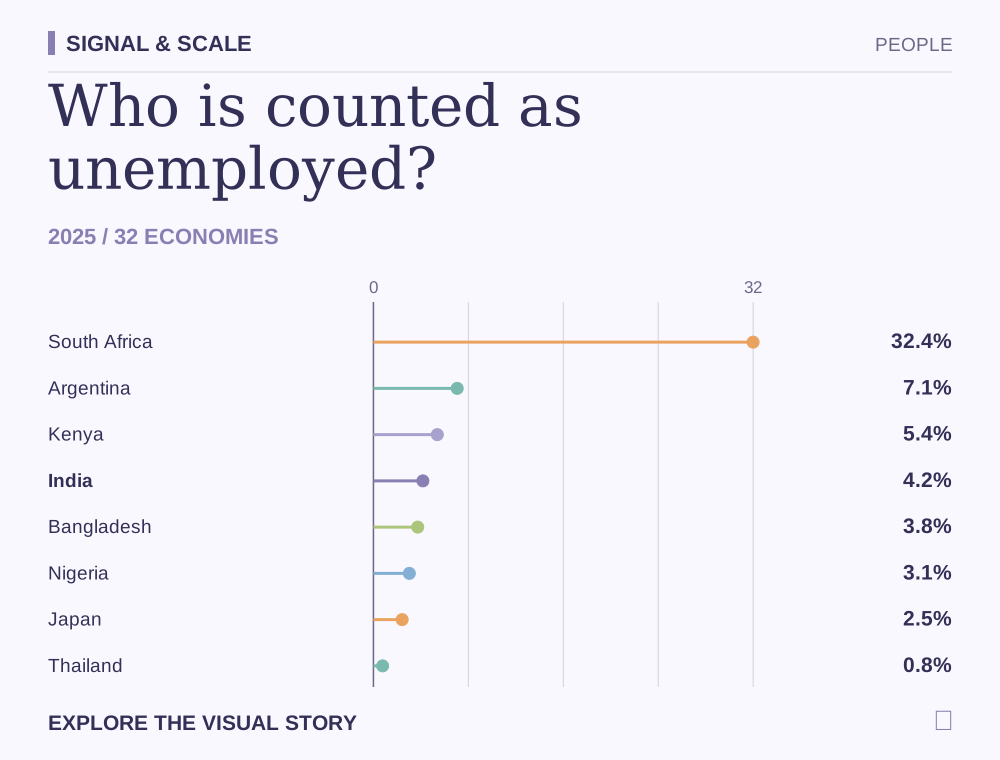
Who is counted as unemployed?
A small headline rate can conceal a complicated labor market.
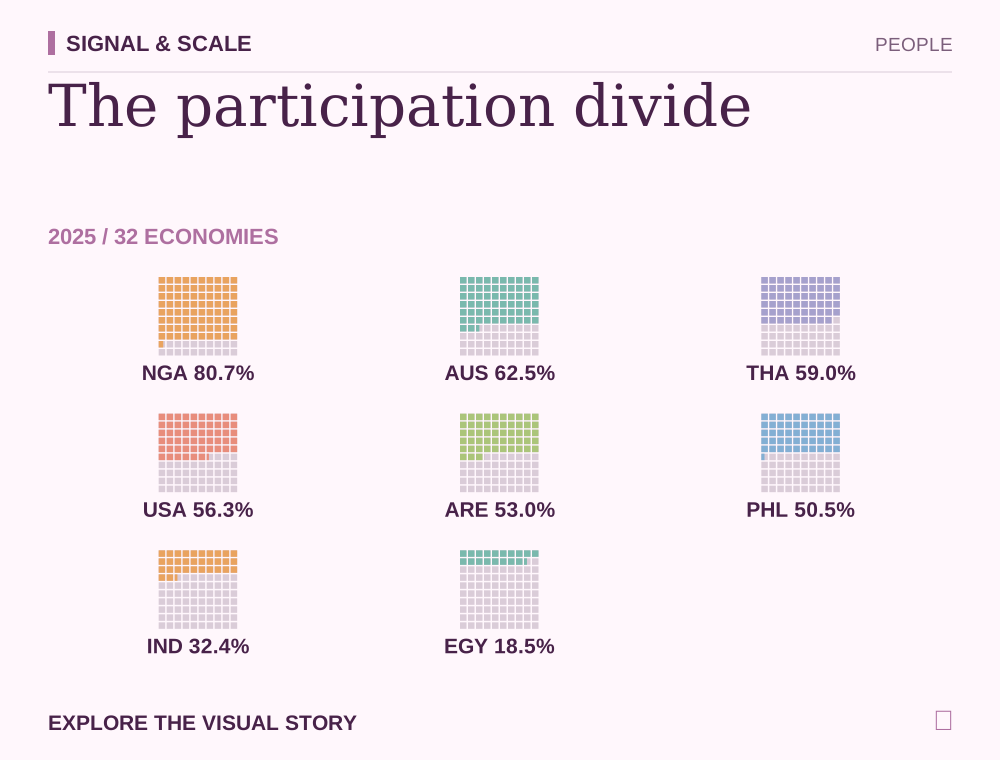
The participation divide
Women's access to paid work differs sharply across economies.
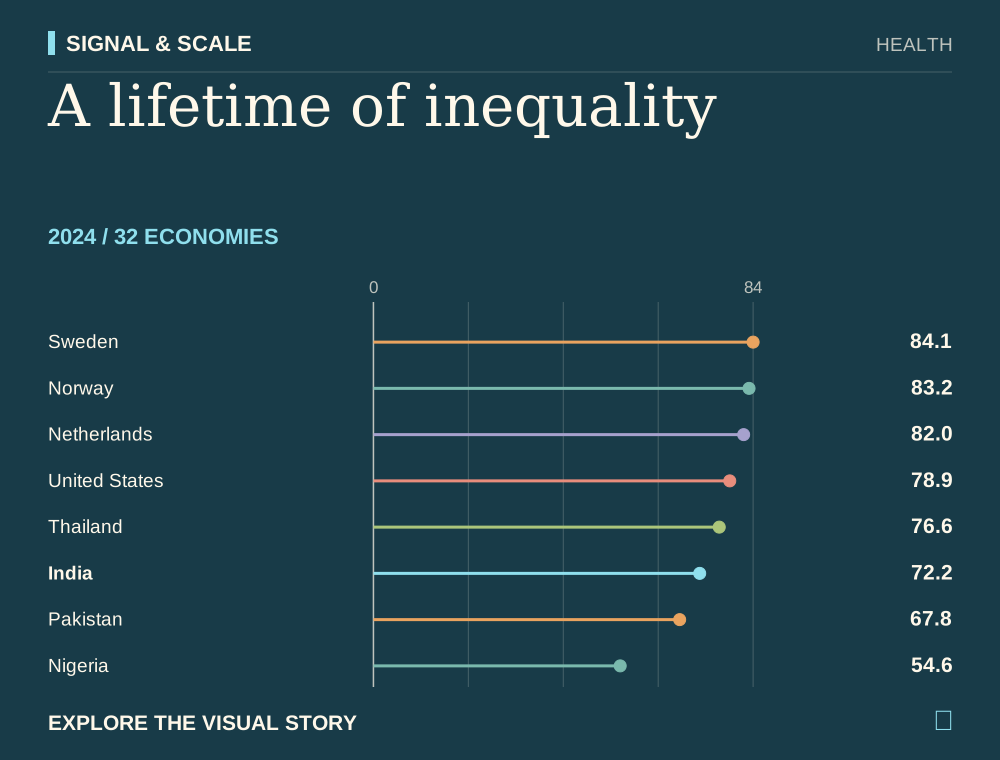
A lifetime of inequality
The place where a child is born shapes the average lifespan they can expect.
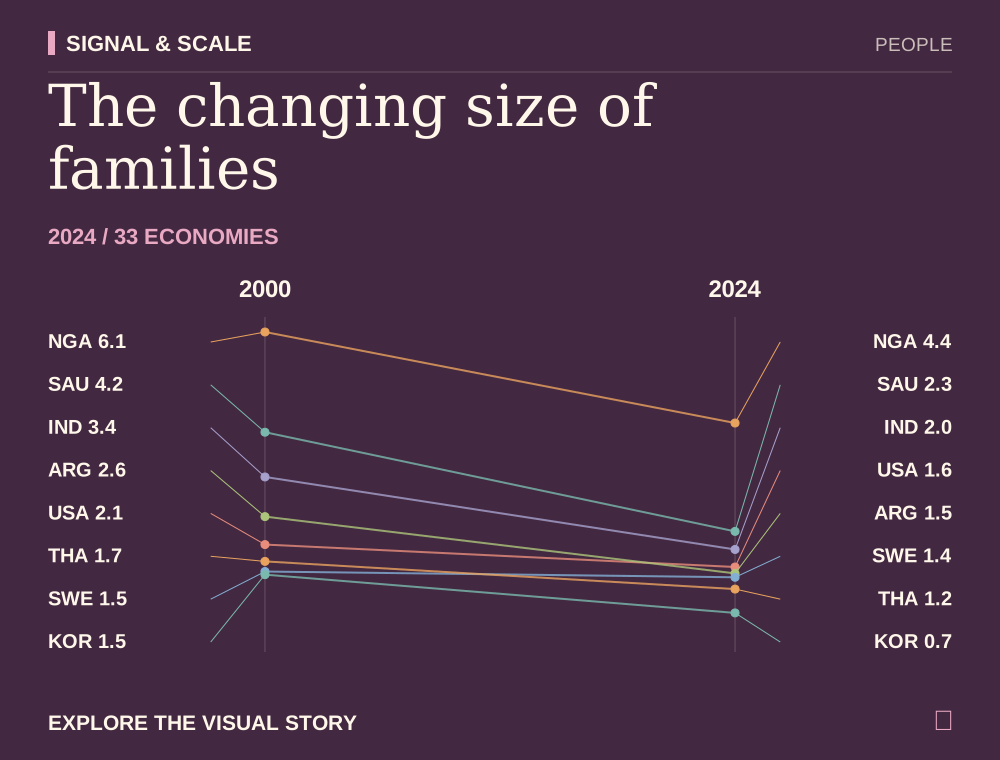
The changing size of families
Fertility has moved far beyond a simple rich-country divide.
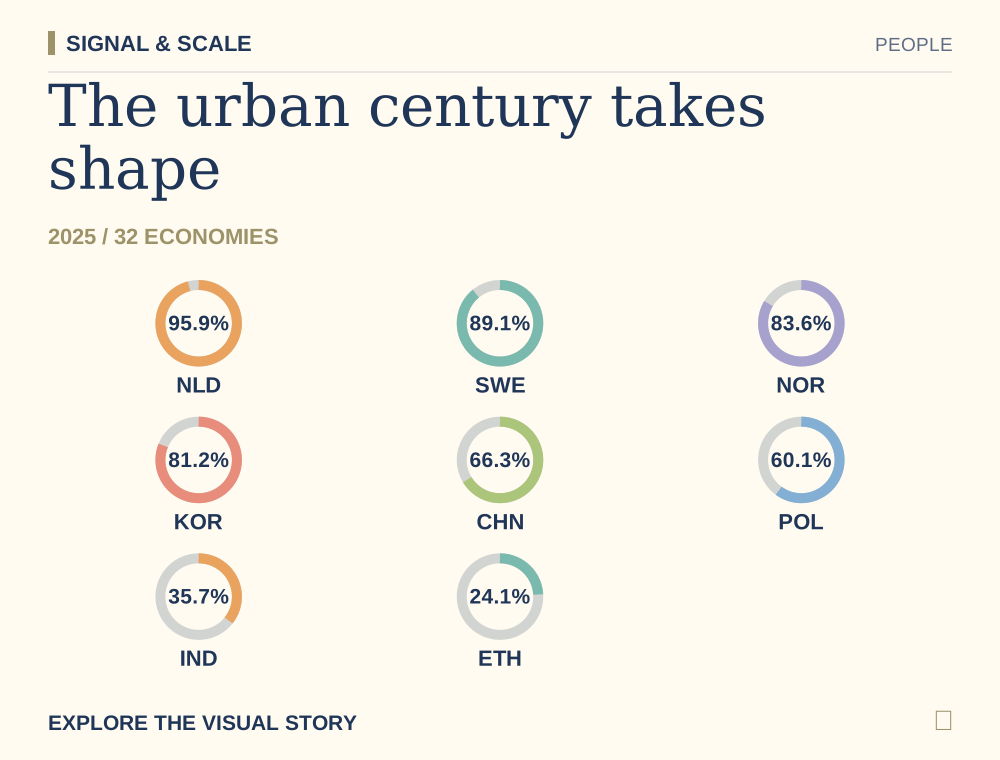
The urban century takes shape
Urban living is common, but its reach varies widely.
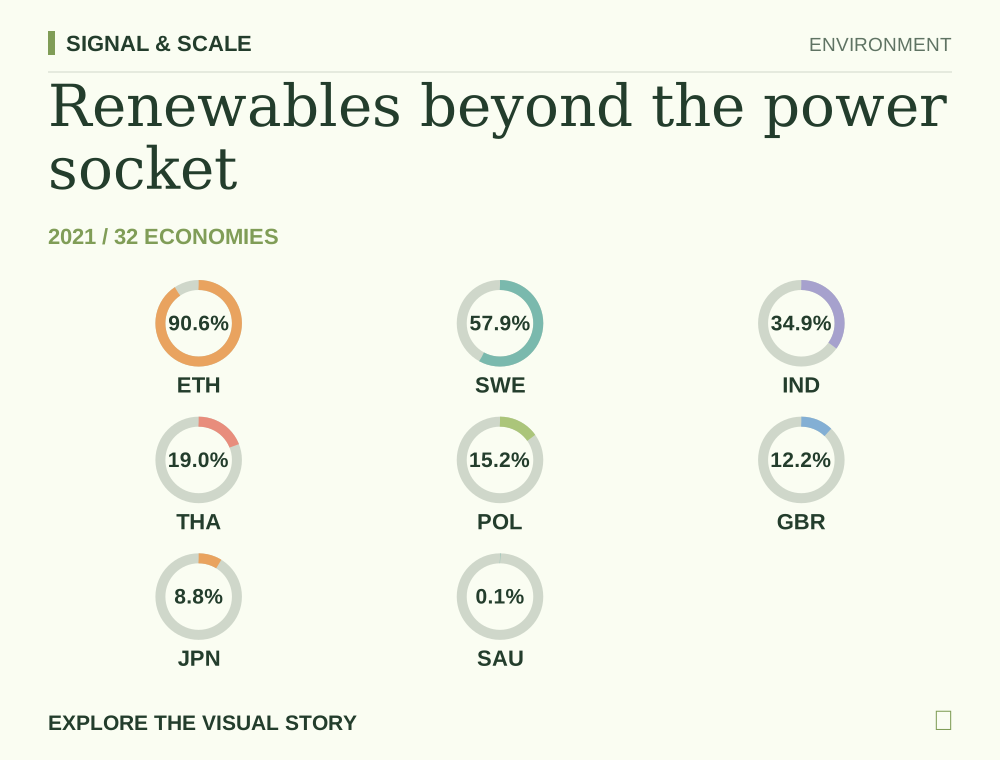
Renewables beyond the power socket
Renewable energy includes far more than electricity.
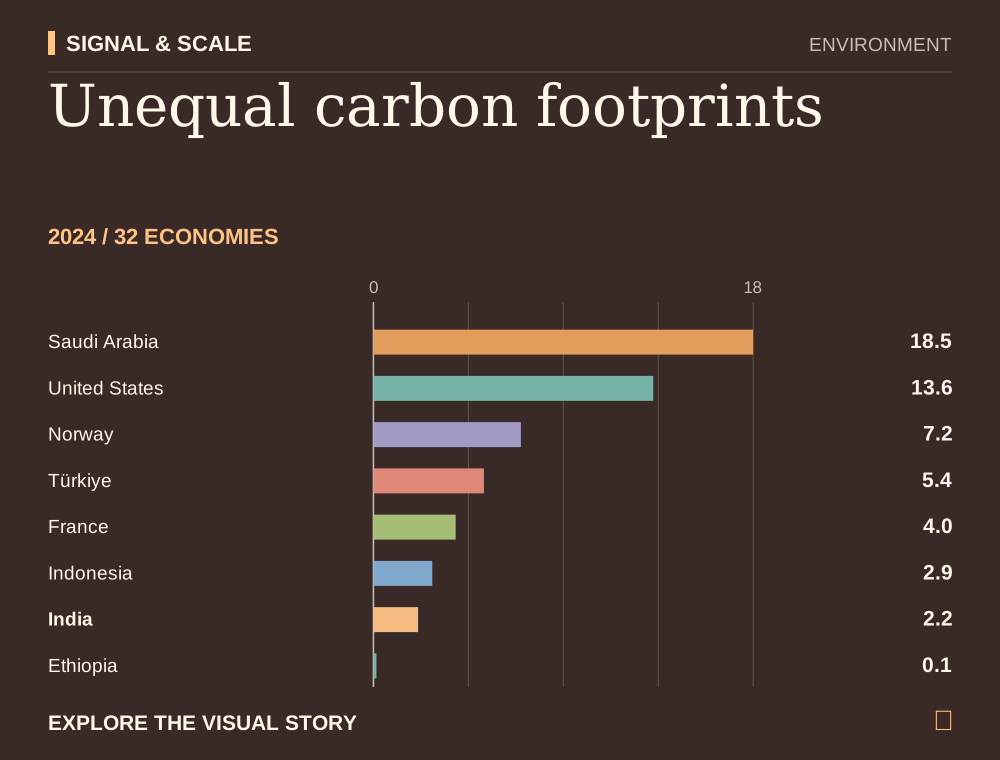
Unequal carbon footprints
Per-person emissions reveal a different picture from national totals.
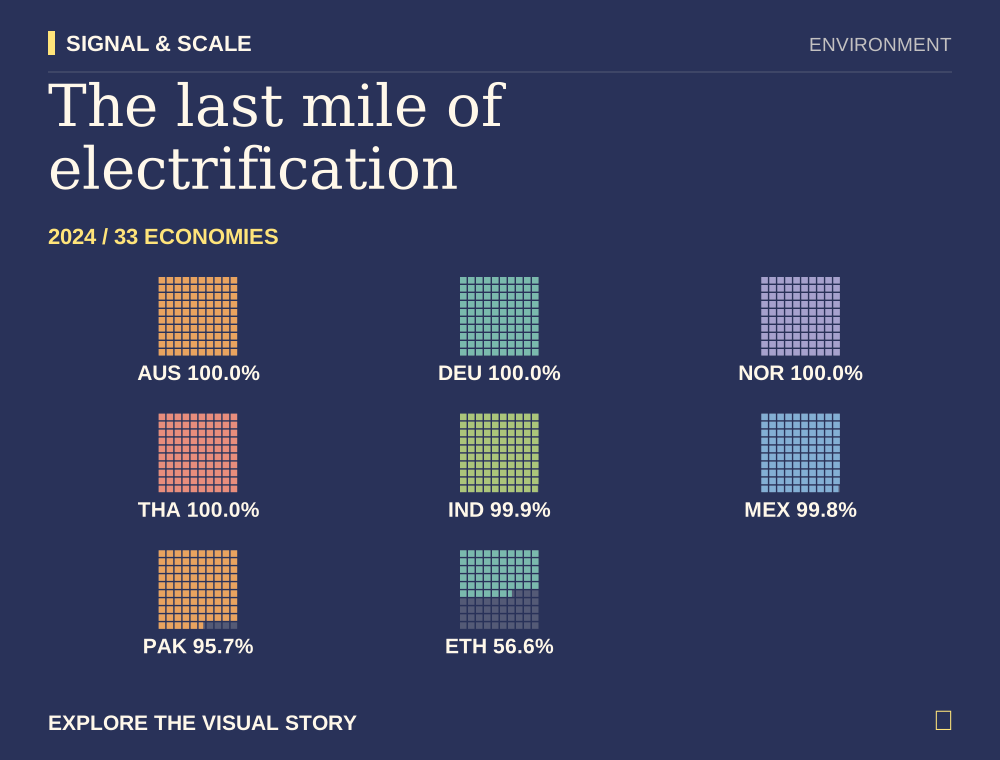
The last mile of electrification
Connection is a milestone, and universal access remains uneven.
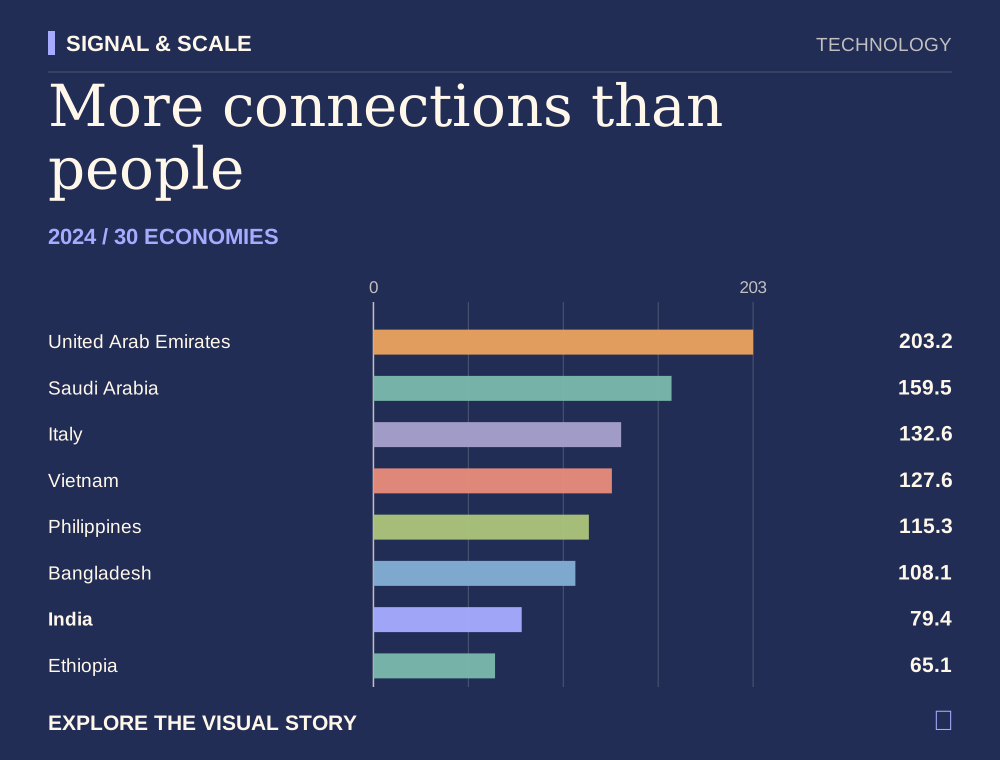
More connections than people
One hundred subscriptions does not mean everyone has a phone.
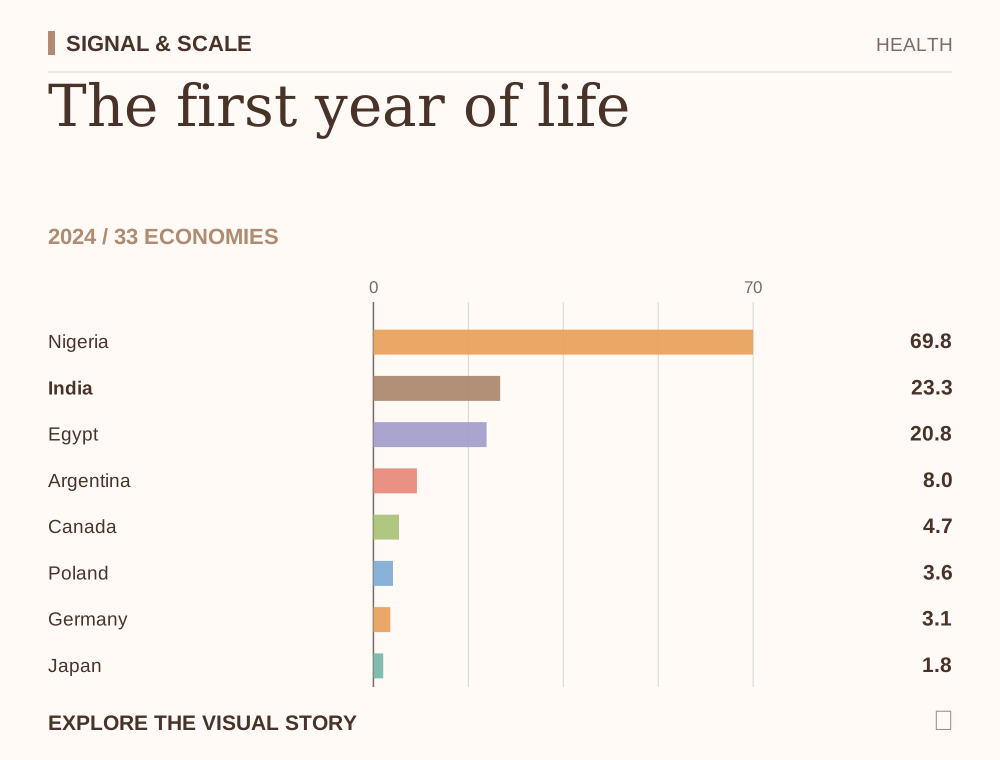
The first year of life
Infant survival reveals deep differences in health conditions.
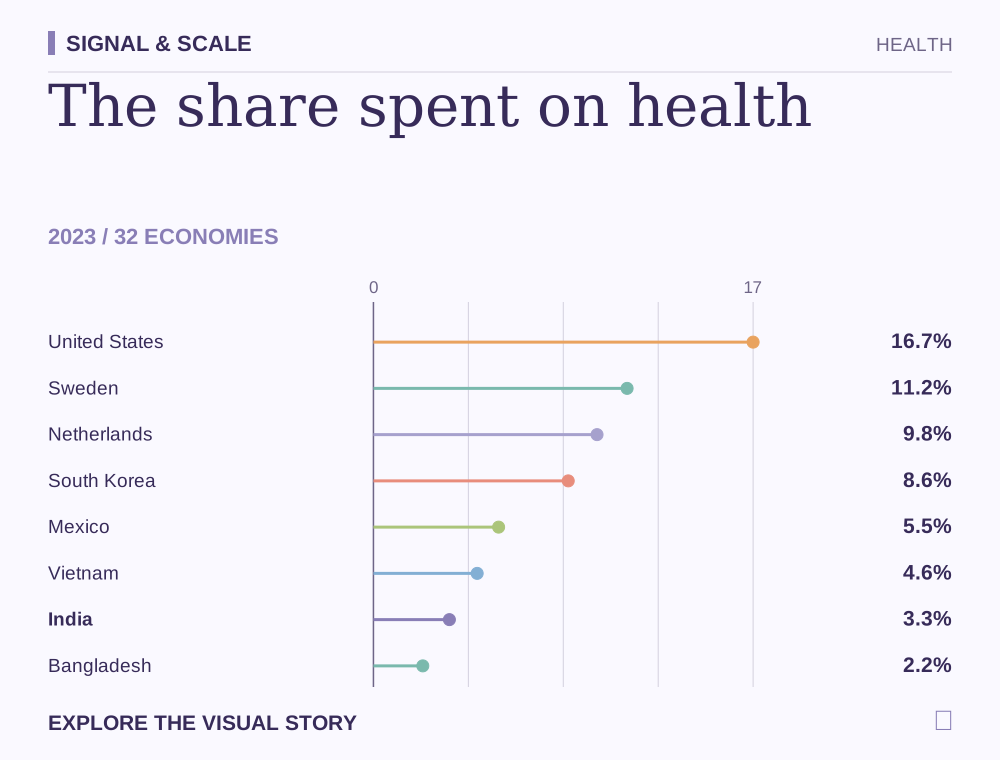
The share spent on health
Spending shares reveal priorities, but not the quality of care.
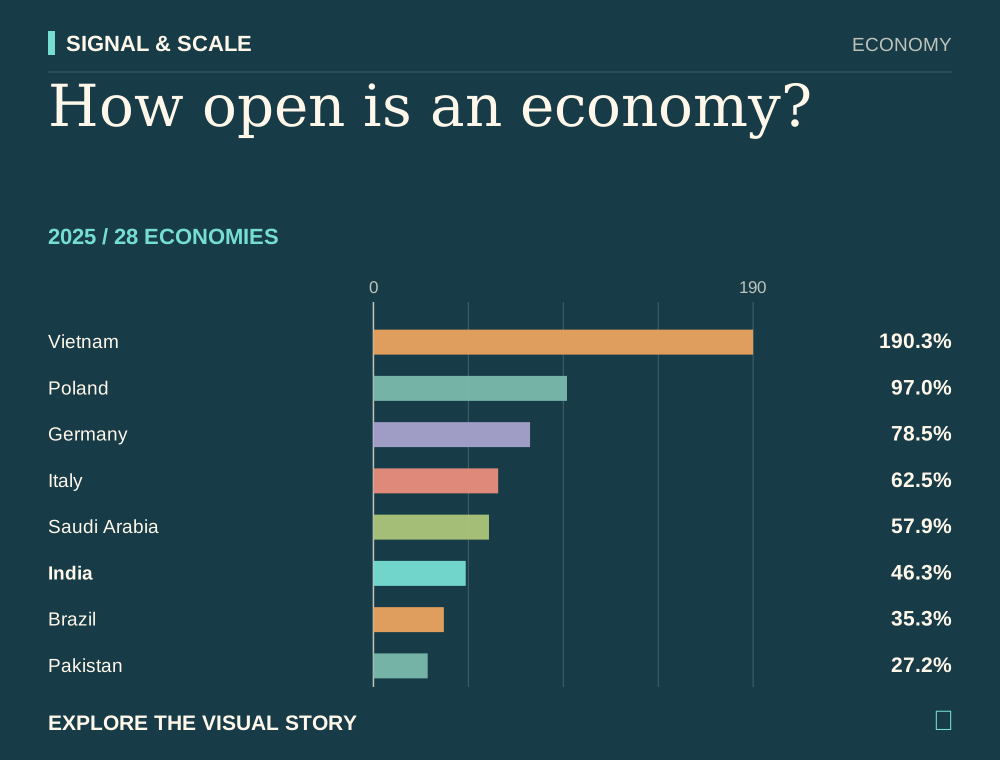
How open is an economy?
Trade flows can be larger than annual domestic output.
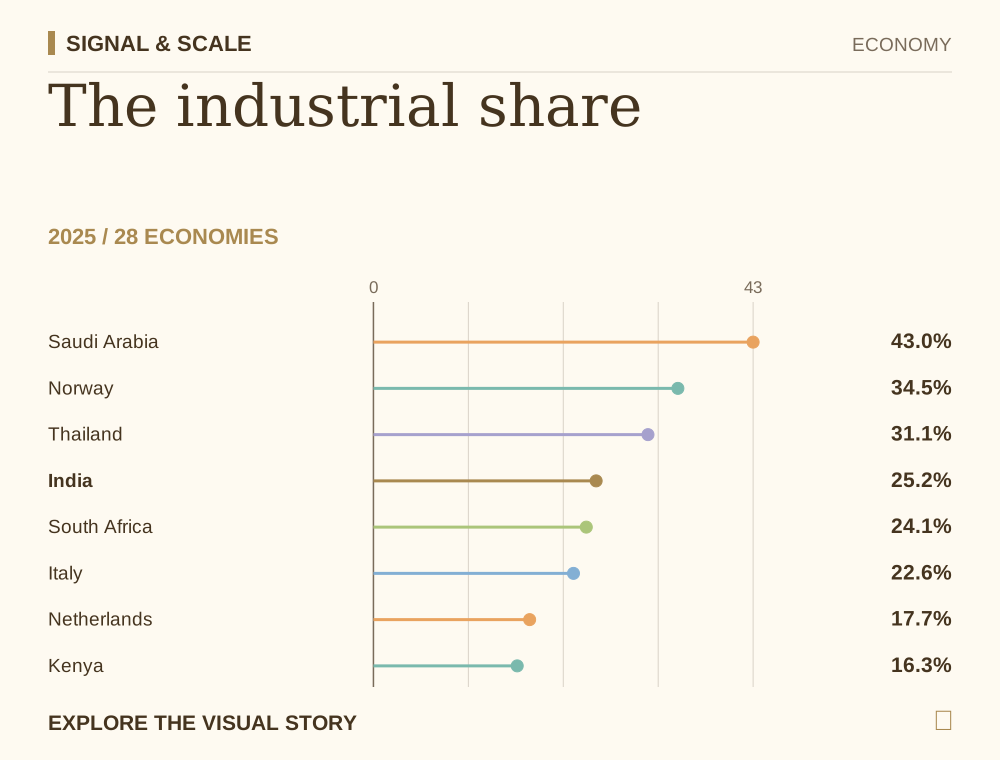
The industrial share
Industry's contribution reflects very different production systems.
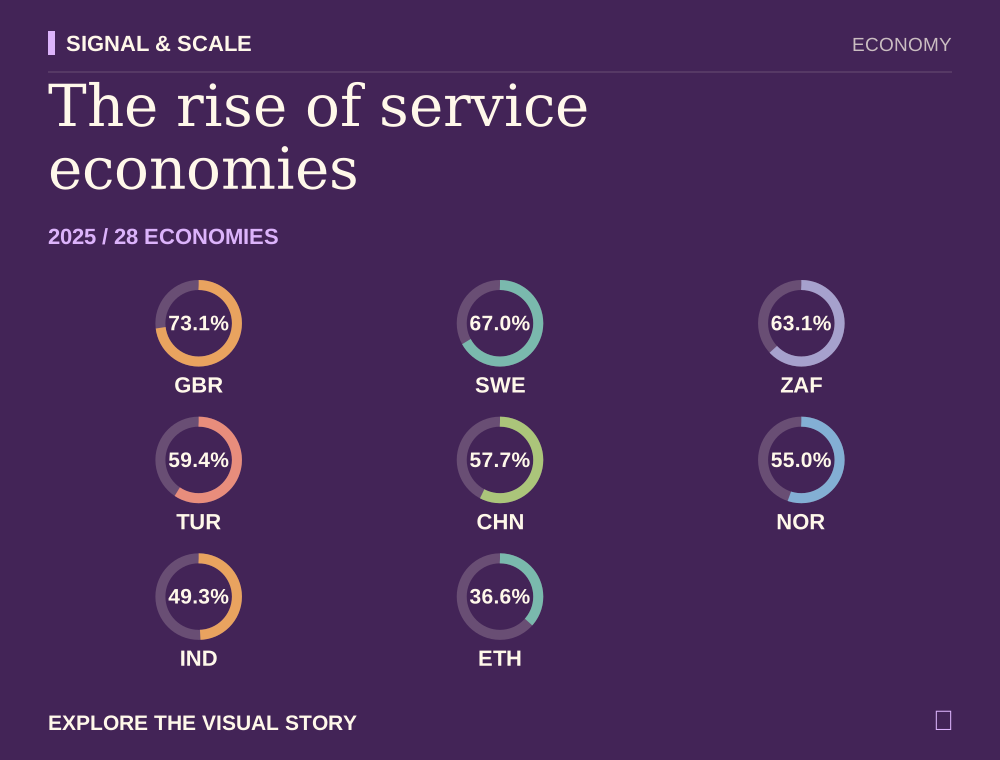
The rise of service economies
Services cover everything from everyday trade to advanced finance.
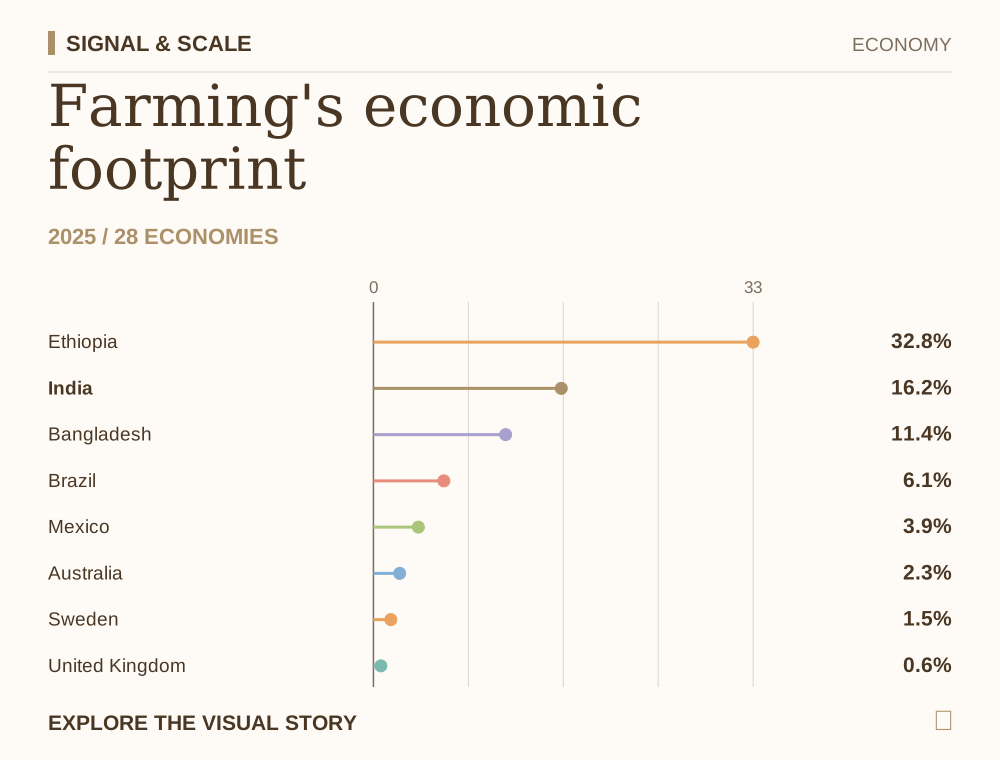
Farming's economic footprint
Agriculture's output share tells only part of the rural story.
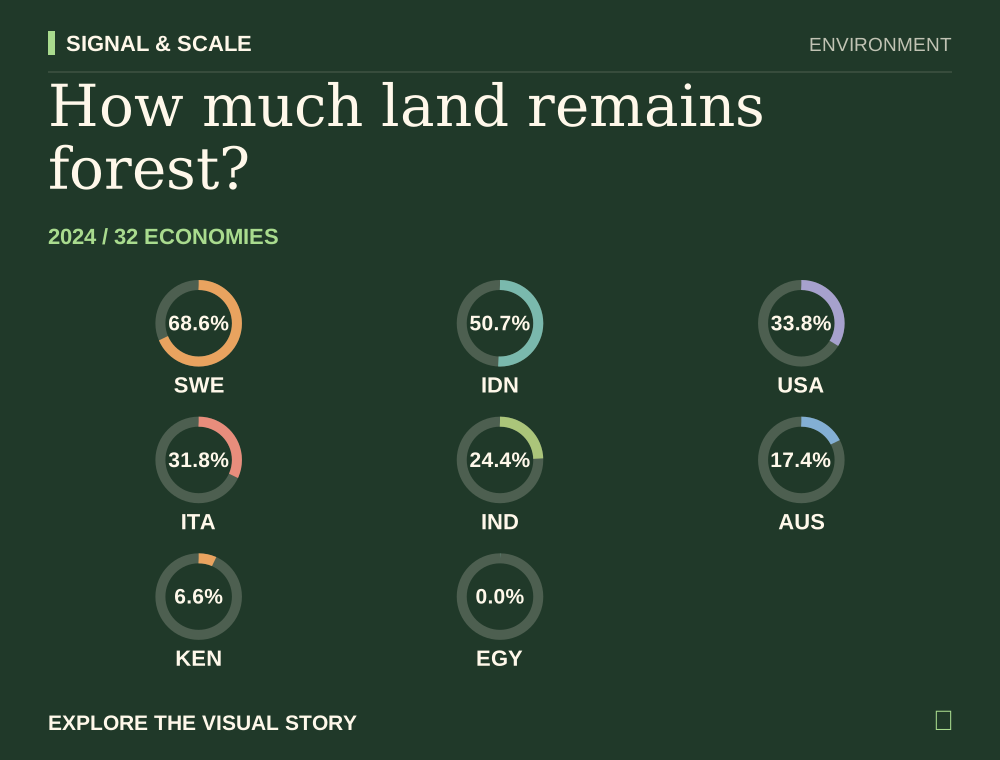
How much land remains forest?
Forest cover spans a vast range across economies.
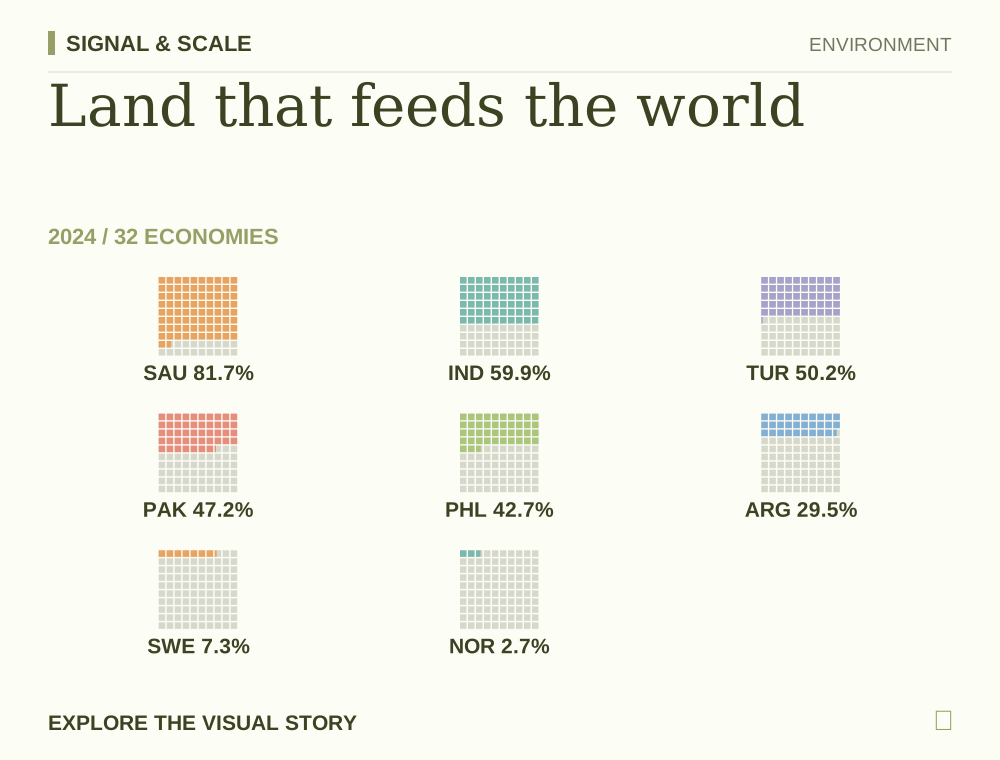
Land that feeds the world
Agricultural land includes fields, orchards and grazing land.
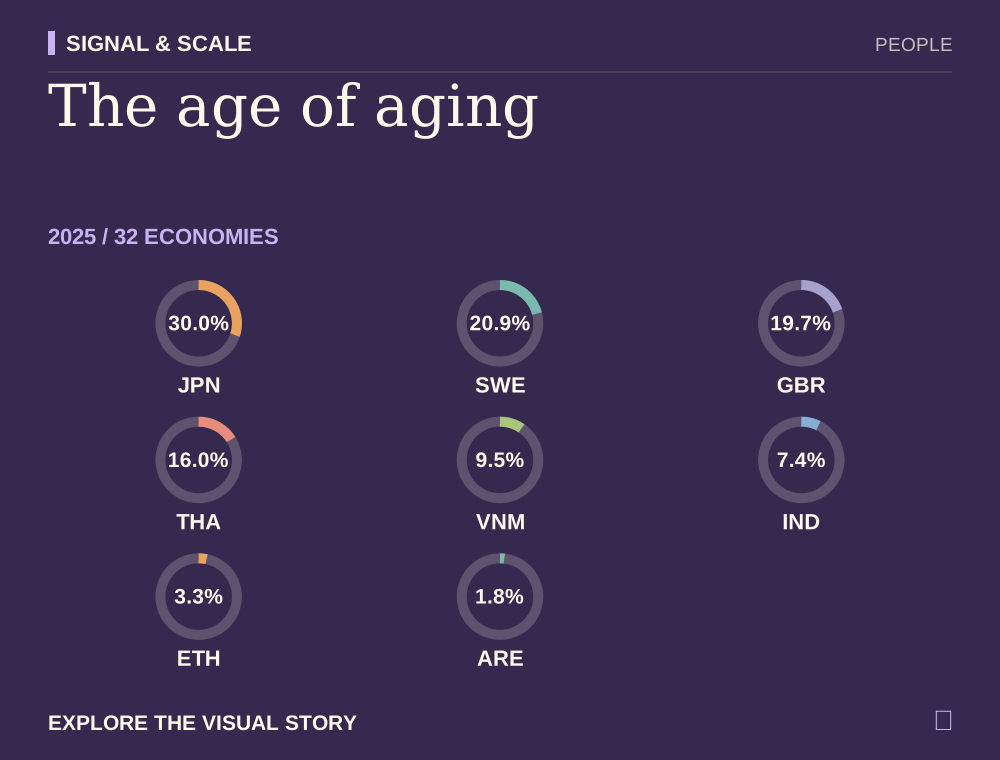
The age of aging
The share of older residents is reshaping societies.
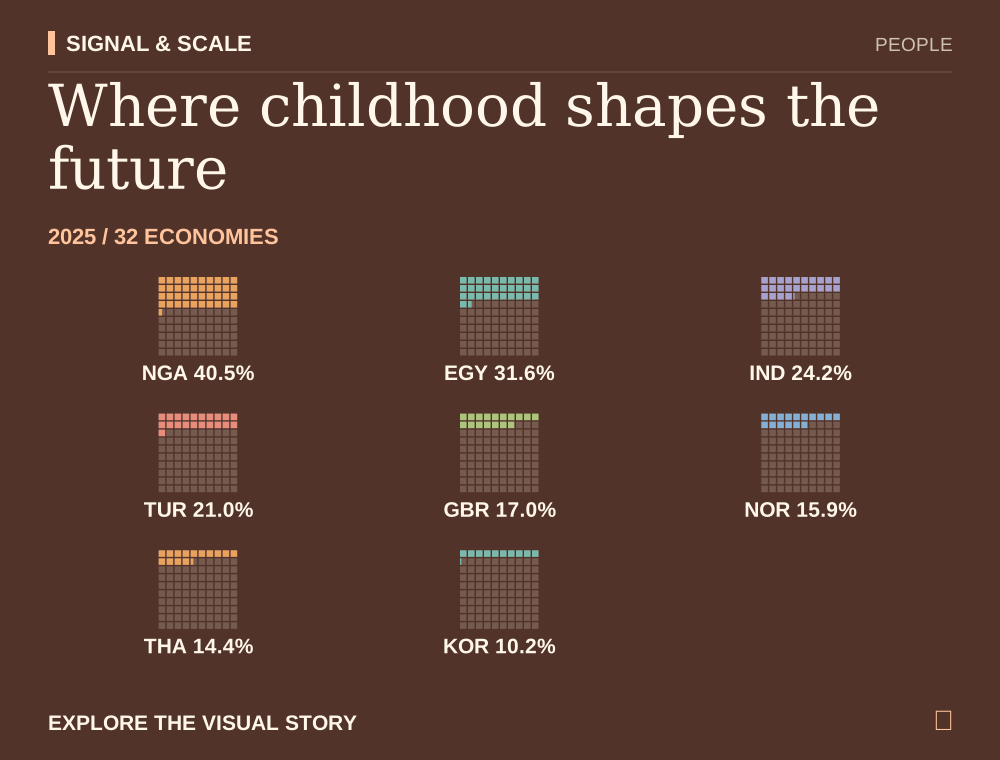
Where childhood shapes the future
Young populations bring distinctive needs for education and opportunity.
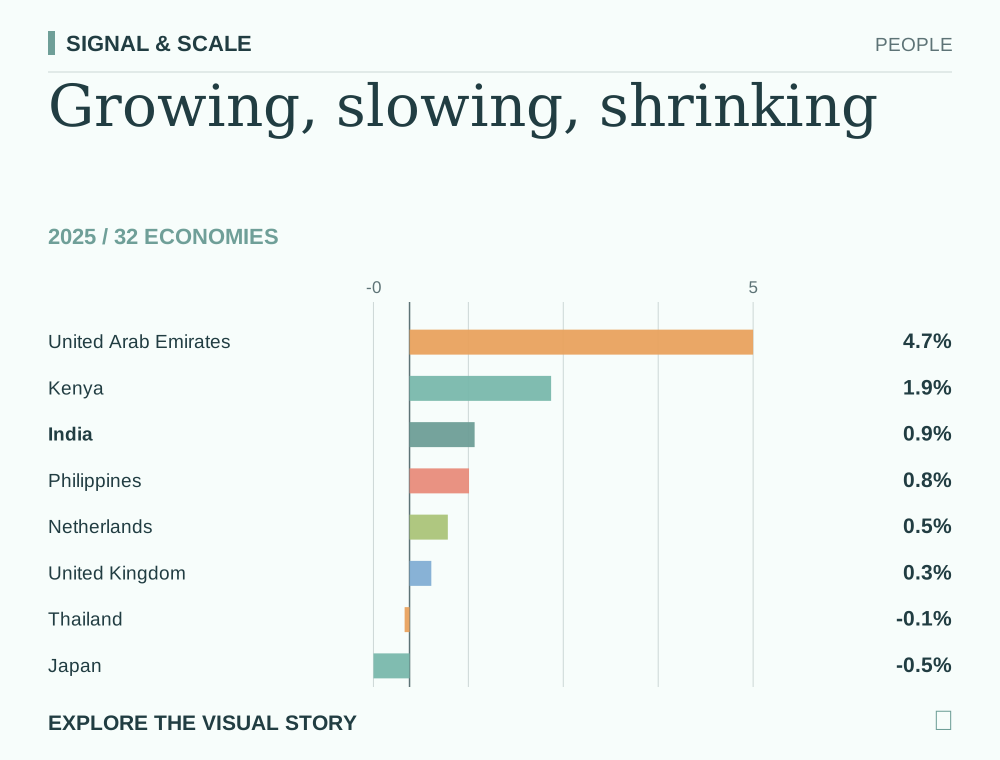
Growing, slowing, shrinking
Population change reflects births, deaths and migration together.
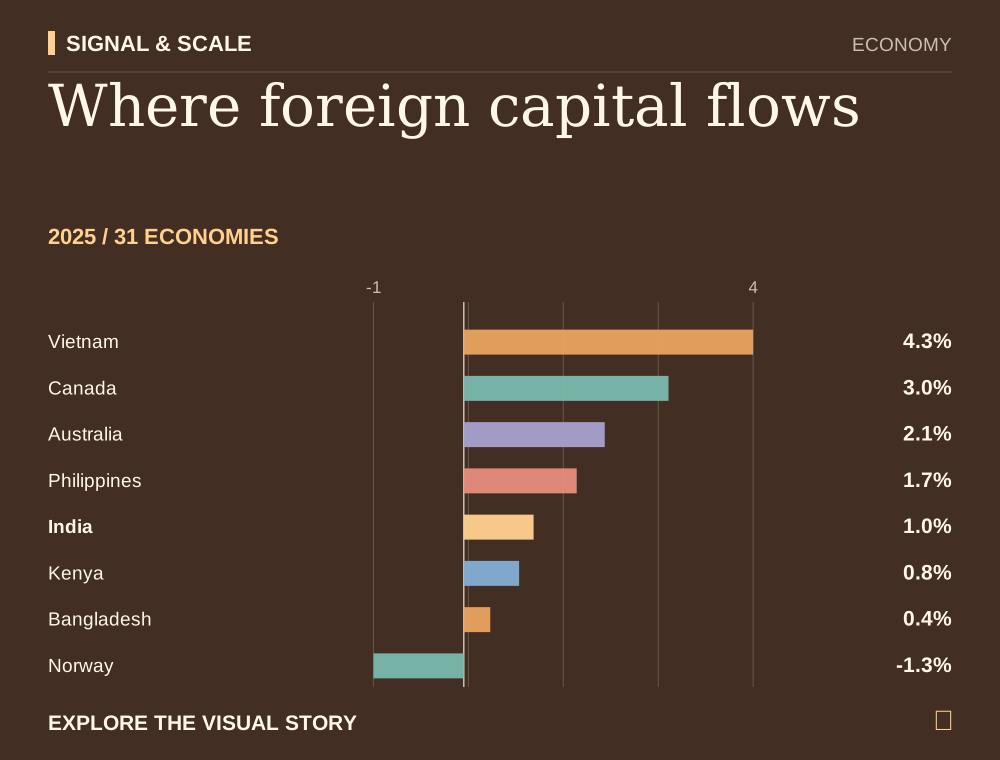
Where foreign capital flows
Investment flows can shift sharply from one year to the next.
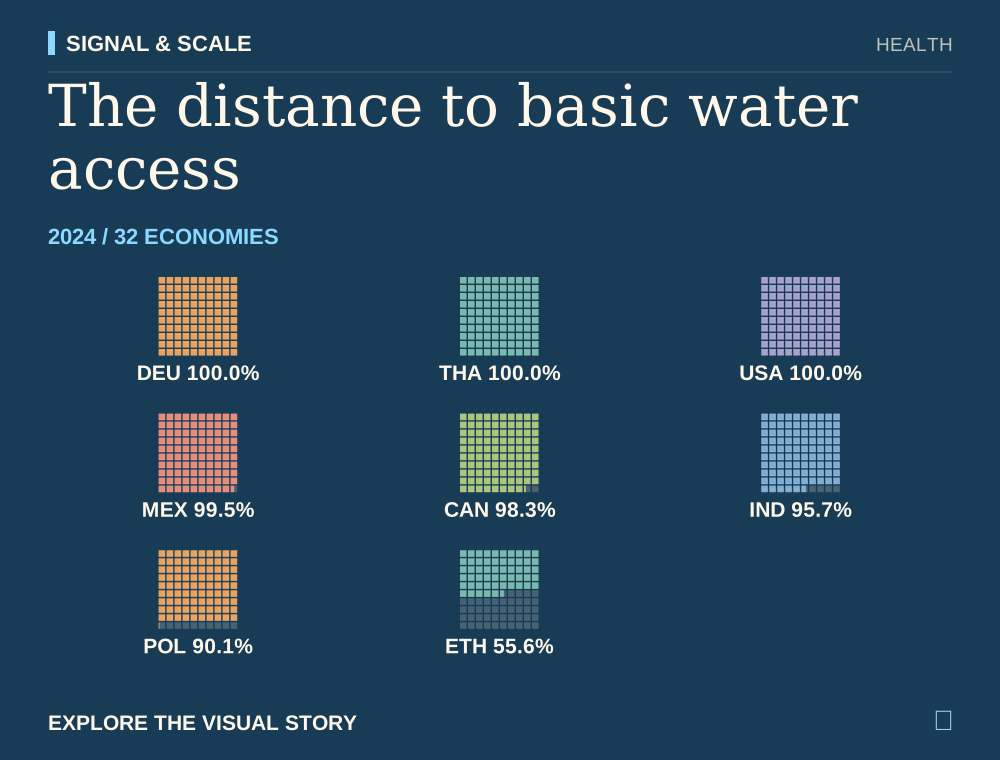
The distance to basic water access
Basic drinking-water access still has a last-mile gap.
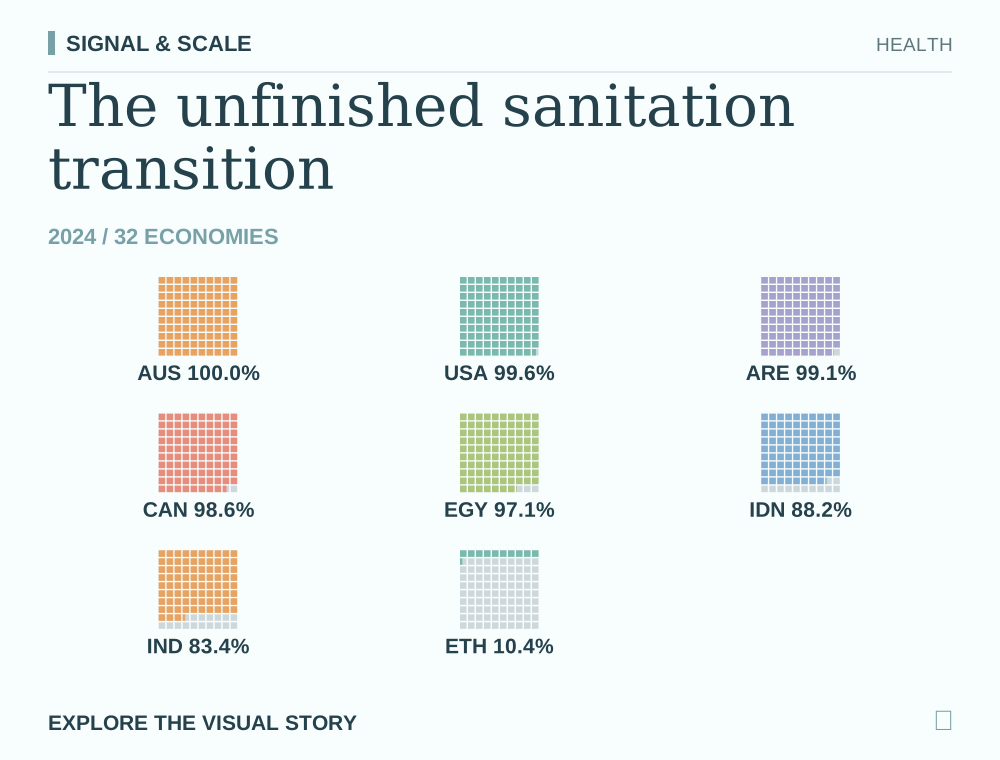
The unfinished sanitation transition
Sanitation coverage reveals an essential development gap.
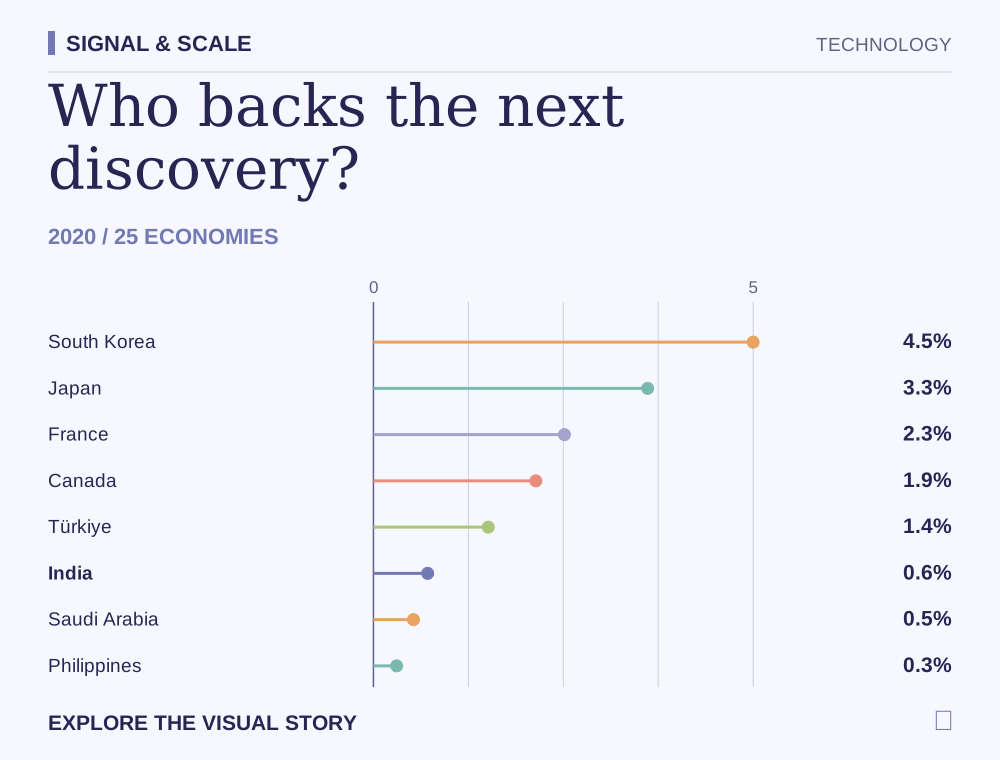
Who backs the next discovery?
Research intensity varies by an order of magnitude.
No matching stories yet. Try another topic or search.