VISUAL FEATURE DEMOGRAPHY
India’s fertility rate fell by two-thirds
Sixty-five years of national estimates show a steep decline. Two rounds of household surveys reveal how uneven the shift has been across states.
SIGNAL & SCALE / WORLD BANK + NATIONAL FAMILY HEALTH SURVEY
01 / ACROSS INDIA
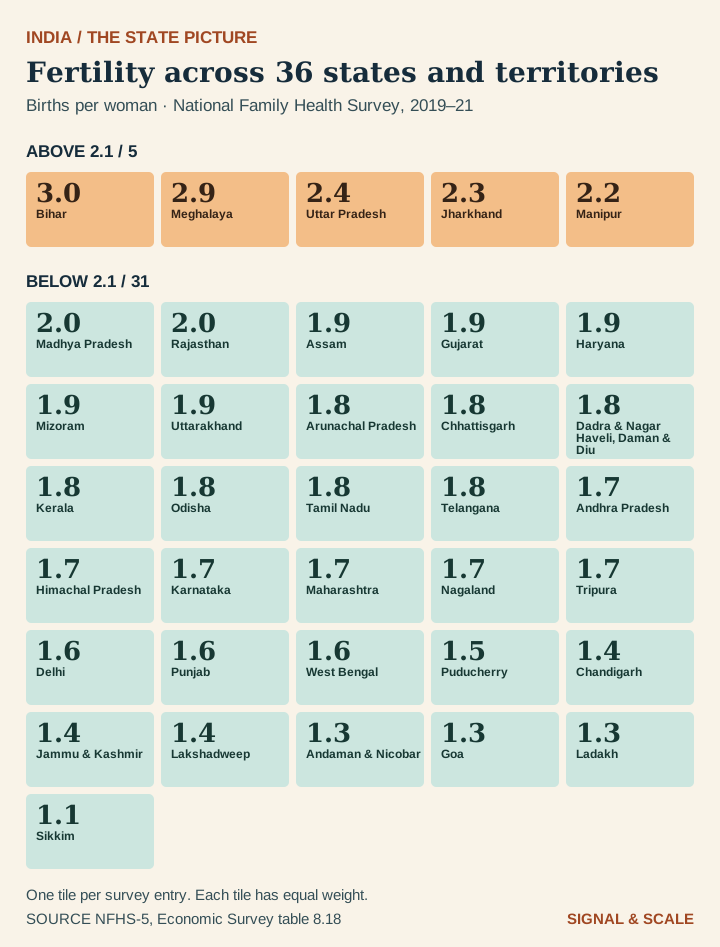
Only five states were above 2.1
In the 2019–21 household survey, 5 of 36 states and territories were above the approximate replacement level of 2.1 births per woman. Bihar was at 3.0, while Sikkim was at 1.1. Each tile represents one survey entry, regardless of population size.
02 / NATIONAL TREND
From nearly six to under two
In 1960, India’s total fertility rate was 5.92 births per woman. By 2000 it was 3.35. The World Bank series first fell below the commonly used replacement benchmark of 2.1 in 2020 and reached 1.96 in 2024.
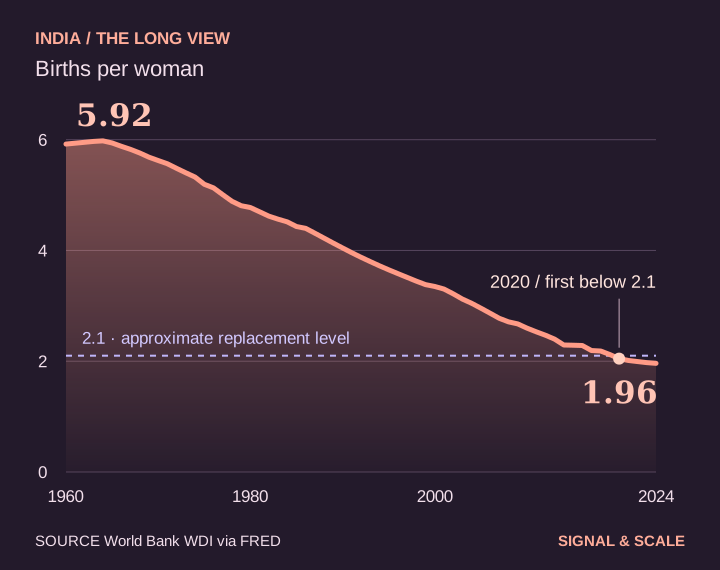
Crossing 2.1 does not mean the population starts shrinking that year. The number of people already entering or passing through childbearing ages affects how births and deaths balance, and migration also affects population change.
03 / WHAT CHANGED
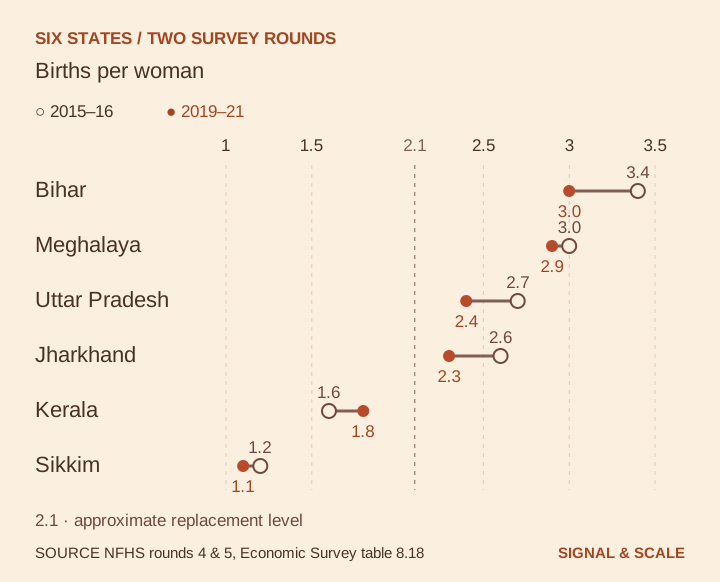
The national figure hides different trajectories
In the household survey, Bihar fell from 3.4 to 3.0 between rounds. Uttar Pradesh also fell but remained above 2.1. Kerala moved in the other direction, from 1.6 to 1.8, and stayed below the benchmark. The chart shows six cases; the data table includes all 36 entries published for the latest survey round.
04 / SOURCES AND DATA
Two measures, two different uses
The World Bank indicator gives an annual national series, archived for this story from FRED. The Economic Survey’s table 8.18 reports household-survey estimates by state and union territory. They cover survey rounds and are shown separately from the national annual estimates. The NFHS-5 Jammu and Kashmir entry excludes Ladakh.
Total fertility rate estimates the number of births per woman if a given period’s age-specific fertility rates applied throughout the childbearing years. It is a period measure, not a count of actual births per individual.
View all 65 national estimates
| Year | Births per woman |
|---|---|
| 1960 | 5.921 |
| 1961 | 5.937 |
| 1962 | 5.953 |
| 1963 | 5.969 |
| 1964 | 5.979 |
| 1965 | 5.941 |
| 1966 | 5.881 |
| 1967 | 5.825 |
| 1968 | 5.760 |
| 1969 | 5.684 |
| 1970 | 5.624 |
| 1971 | 5.565 |
| 1972 | 5.482 |
| 1973 | 5.402 |
| 1974 | 5.325 |
| 1975 | 5.195 |
| 1976 | 5.130 |
| 1977 | 5.007 |
| 1978 | 4.888 |
| 1979 | 4.808 |
| 1980 | 4.775 |
| 1981 | 4.698 |
| 1982 | 4.620 |
| 1983 | 4.565 |
| 1984 | 4.516 |
| 1985 | 4.432 |
| 1986 | 4.399 |
| 1987 | 4.311 |
| 1988 | 4.222 |
| 1989 | 4.132 |
| 1990 | 4.045 |
| 1991 | 3.959 |
| 1992 | 3.877 |
| 1993 | 3.799 |
| 1994 | 3.723 |
| 1995 | 3.651 |
| 1996 | 3.582 |
| 1997 | 3.514 |
| 1998 | 3.446 |
| 1999 | 3.383 |
| 2000 | 3.350 |
| 2001 | 3.303 |
| 2002 | 3.217 |
| 2003 | 3.122 |
| 2004 | 3.046 |
| 2005 | 2.958 |
| 2006 | 2.867 |
| 2007 | 2.775 |
| 2008 | 2.711 |
| 2009 | 2.674 |
| 2010 | 2.598 |
| 2011 | 2.532 |
| 2012 | 2.470 |
| 2013 | 2.399 |
| 2014 | 2.293 |
| 2015 | 2.289 |
| 2016 | 2.284 |
| 2017 | 2.193 |
| 2018 | 2.184 |
| 2019 | 2.120 |
| 2020 | 2.047 |
| 2021 | 2.014 |
| 2022 | 1.994 |
| 2023 | 1.975 |
| 2024 | 1.962 |
View all 36 state and territory entries
| State or territory | 2015–16 | 2019–21 |
|---|---|---|
| Andaman and Nicobar (UT) | 1.4 | 1.3 |
| Andhra Pradesh | 1.8 | 1.7 |
| Arunachal Pradesh | 2.1 | 1.8 |
| Assam | 2.2 | 1.9 |
| Bihar | 3.4 | 3.0 |
| Chandigarh (UT) | 1.6 | 1.4 |
| Chhattisgarh | 2.2 | 1.8 |
| Dadra and Nagar Haveli & Daman Diu (UT) | 2.1 | 1.8 |
| Delhi | 1.8 | 1.6 |
| Goa | 1.7 | 1.3 |
| Gujarat | 2.0 | 1.9 |
| Haryana | 2.1 | 1.9 |
| Himachal Pradesh | 1.9 | 1.7 |
| Jammu and Kashmir | 2.0 | 1.4 |
| Jharkhand | 2.6 | 2.3 |
| Karnataka | 1.8 | 1.7 |
| Kerala | 1.6 | 1.8 |
| Ladakh (UT) | Unavailable | 1.3 |
| Lakshadweep (UT) | 1.8 | 1.4 |
| Madhya Pradesh | 2.3 | 2.0 |
| Maharashtra | 1.9 | 1.7 |
| Manipur | 2.6 | 2.2 |
| Meghalaya | 3.0 | 2.9 |
| Mizoram | 2.3 | 1.9 |
| Nagaland | 2.7 | 1.7 |
| Odisha | 2.1 | 1.8 |
| Puducherry (UT) | 1.7 | 1.5 |
| Punjab | 1.6 | 1.6 |
| Rajasthan | 2.4 | 2.0 |
| Sikkim | 1.2 | 1.1 |
| Tamil Nadu | 1.7 | 1.8 |
| Telangana | 1.8 | 1.8 |
| Tripura | 1.7 | 1.7 |
| Uttar Pradesh | 2.7 | 2.4 |
| Uttarakhand | 2.1 | 1.9 |
| West Bengal | 1.8 | 1.6 |