← All visual stories
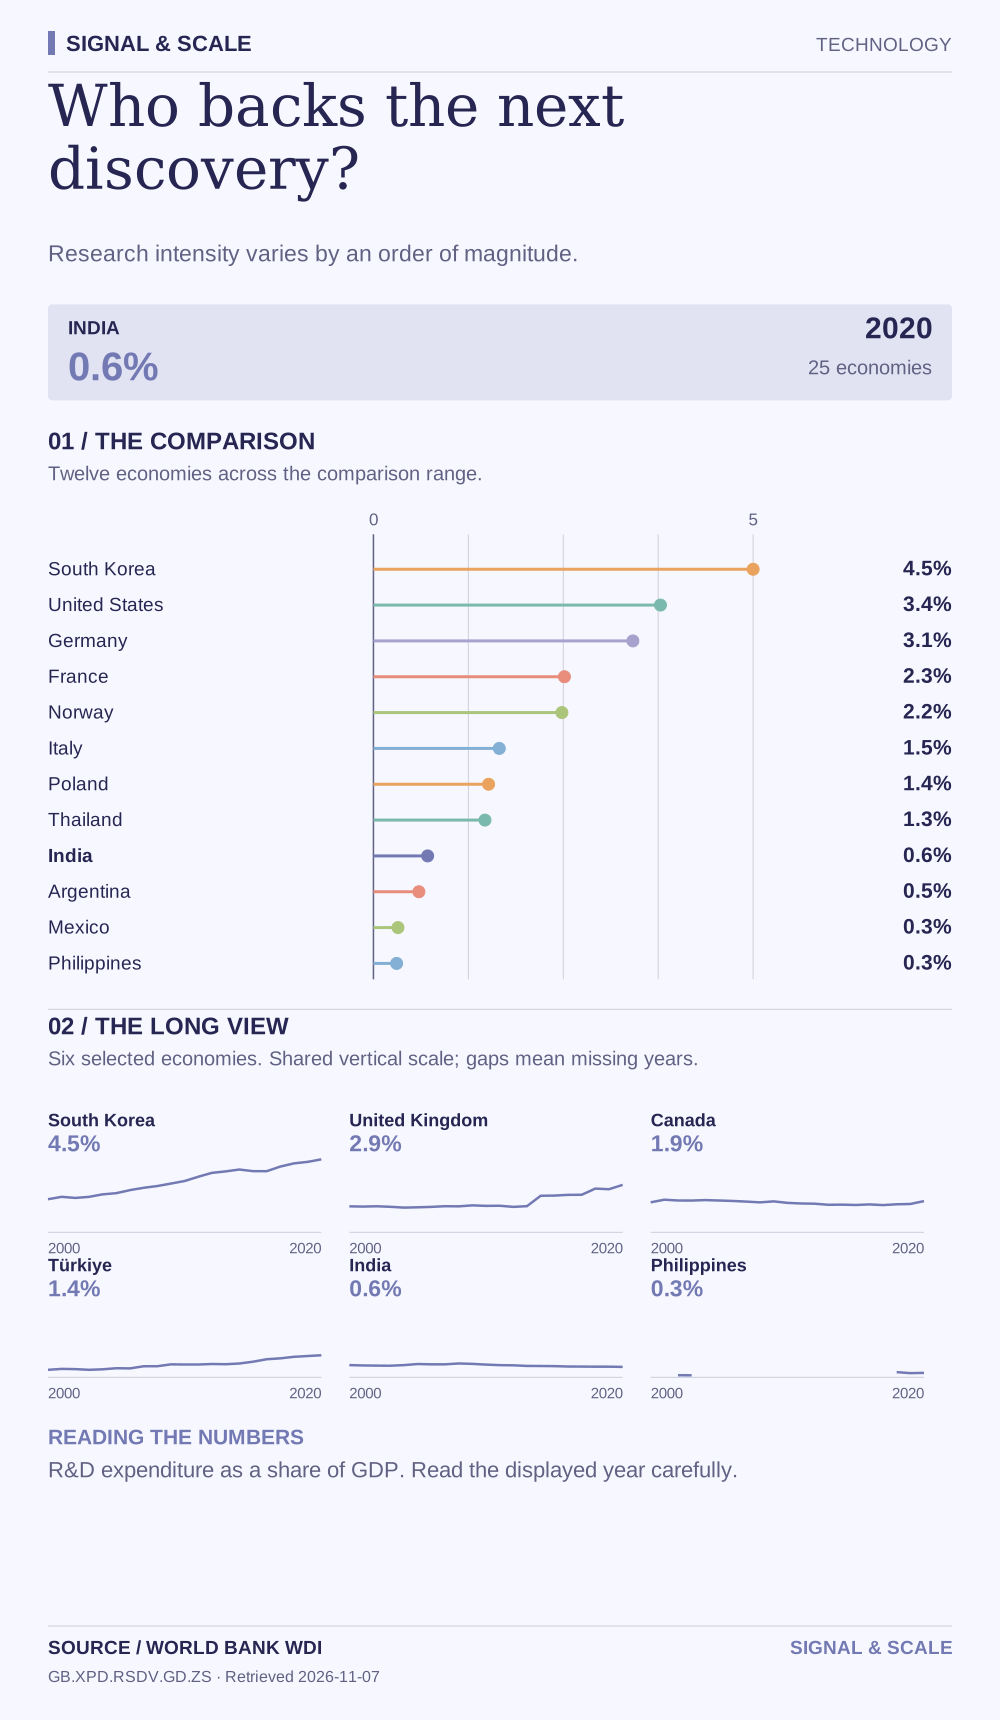
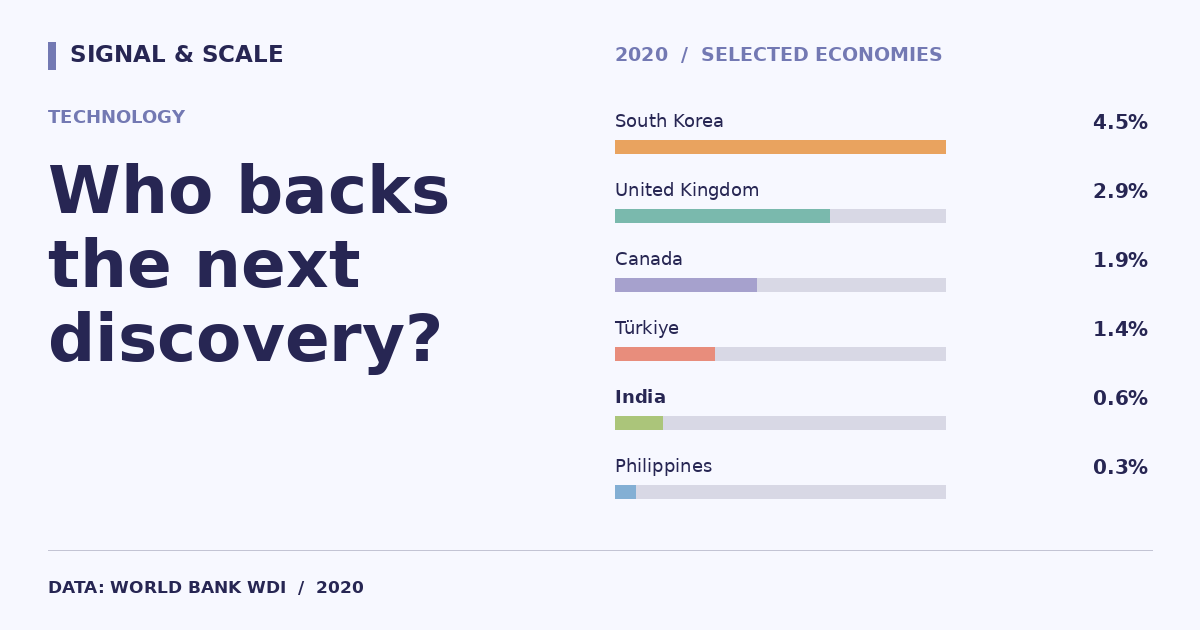
Who backs the next discovery?
Research intensity varies by an order of magnitude.

Explore, download and share
THE STORY BEHIND THE CHART
The story behind the numbers
Research and development expenditure as a share of GDP compares the intensity of investment across economies. It includes current and capital spending on systematic research work. A larger share does not guarantee successful innovation, and publication lags can be substantial.
THE TAKEAWAY
Research intensity varies by an order of magnitude.
Read the numbers carefully
R&D expenditure as a share of GDP. Read the displayed year carefully.
Data behind the visual
This selected comparison includes 25 economies with observations in 2020 shown in % of GDP.
| Country | Value |
|---|---|
| South Korea | 4.5% |
| Sweden | 3.5% |
| United States | 3.4% |
| Japan | 3.3% |
| Germany | 3.1% |
| United Kingdom | 2.9% |
| China | 2.4% |
| France | 2.3% |
| Netherlands | 2.3% |
| Norway | 2.2% |
| Canada | 1.9% |
| Italy | 1.5% |
| United Arab Emirates | 1.5% |
| Poland | 1.4% |
| Türkiye | 1.4% |
| Thailand | 1.3% |
| Brazil | 1.2% |
| Egypt | 0.9% |
| India | 0.6% |
| South Africa | 0.6% |
| Argentina | 0.5% |
| Saudi Arabia | 0.5% |
| Mexico | 0.3% |
| Indonesia | 0.3% |
| Philippines | 0.3% |
EXPLORE THE DATA
Compare any two countries.
Choose two places to inspect this indicator side-by-side. Same source, same year.
VS