← All visual stories
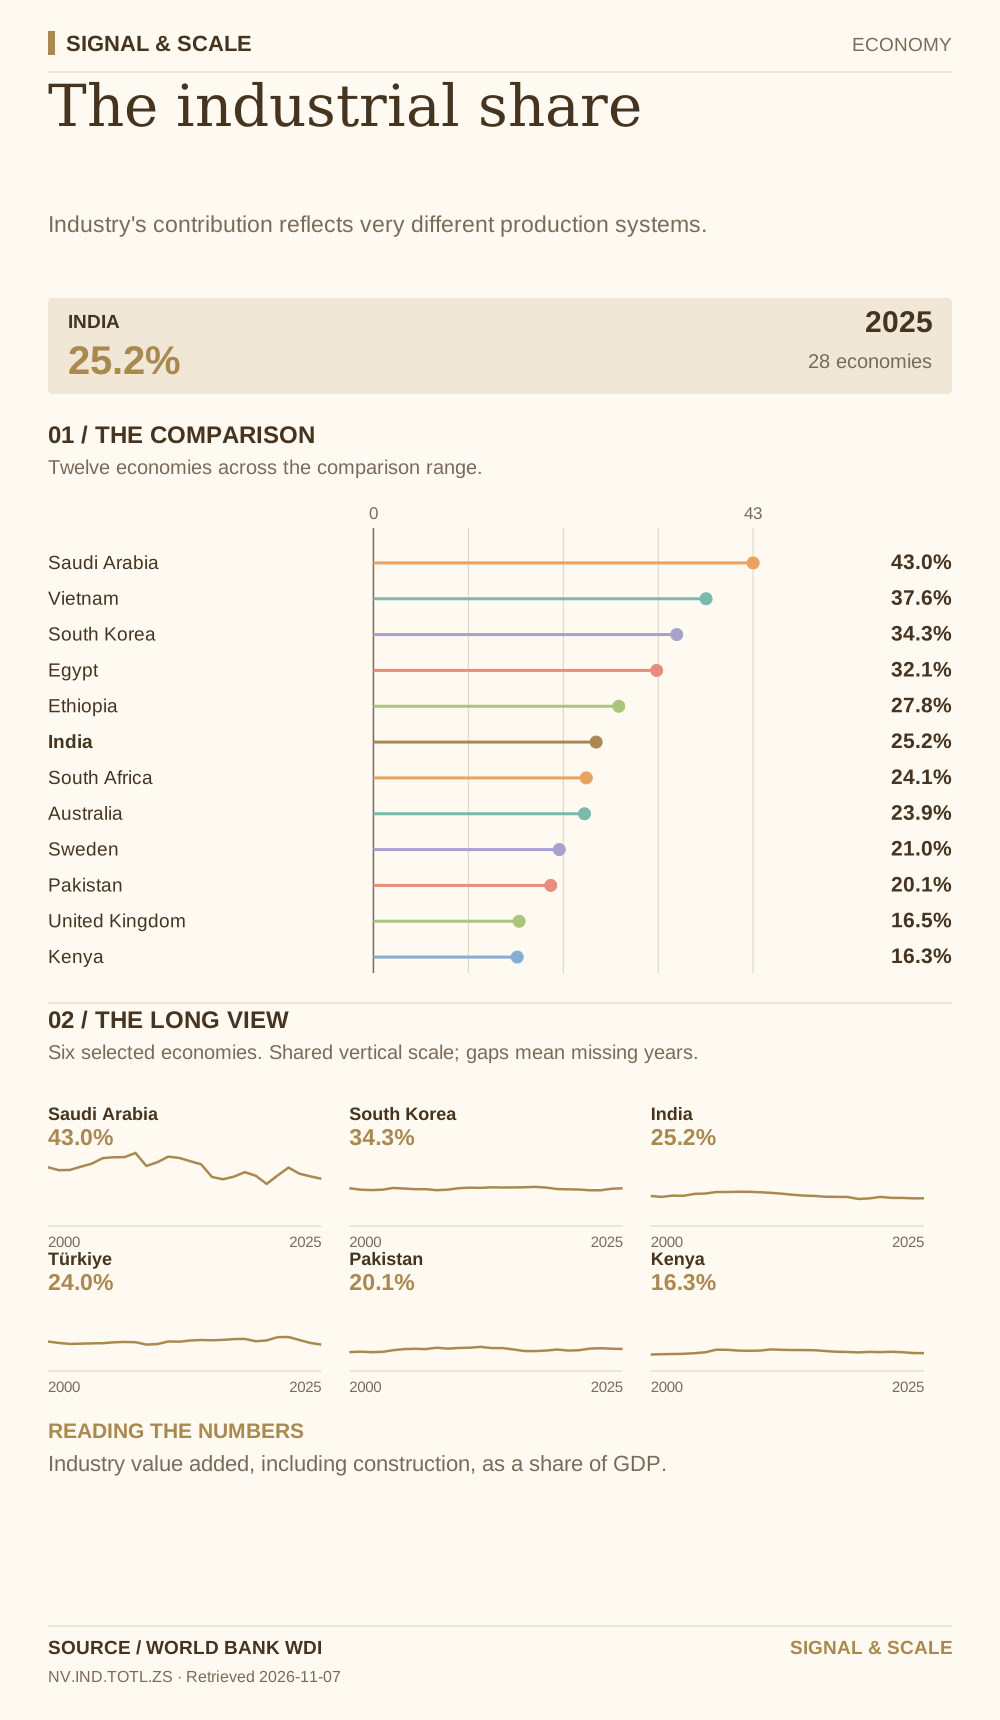
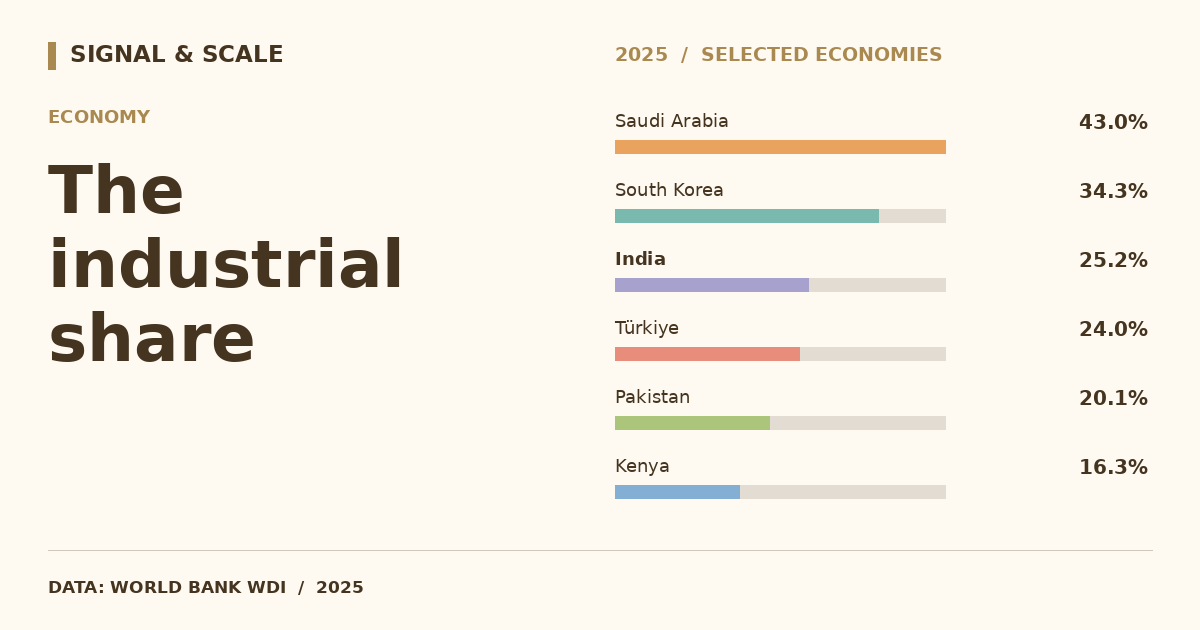
The industrial share
Industry's contribution reflects very different production systems.

Explore, download and share
THE STORY BEHIND THE CHART
The story behind the numbers
Industry includes manufacturing, mining, utilities and construction. Its GDP share can be high for an energy exporter or a manufacturing hub for very different reasons. Changes in the share may reflect commodity prices and the growth of other sectors as well as industrial output.
THE TAKEAWAY
Industry's contribution reflects very different production systems.
Read the numbers carefully
Industry value added, including construction, as a share of GDP.
Data behind the visual
This selected comparison includes 28 economies with observations in 2025 shown in % of GDP.
| Country | Value |
|---|---|
| Saudi Arabia | 43% |
| Indonesia | 38.7% |
| Vietnam | 37.6% |
| China | 35.6% |
| Norway | 34.5% |
| South Korea | 34.3% |
| Bangladesh | 34% |
| Egypt | 32.1% |
| Thailand | 31.1% |
| Mexico | 30.6% |
| Ethiopia | 27.8% |
| Philippines | 27% |
| Poland | 25.8% |
| India | 25.2% |
| Germany | 25.2% |
| South Africa | 24.1% |
| Türkiye | 24% |
| Australia | 23.9% |
| Argentina | 22.9% |
| Italy | 22.6% |
| Sweden | 21% |
| Brazil | 20.1% |
| Pakistan | 20.1% |
| Netherlands | 17.7% |
| France | 16.8% |
| United Kingdom | 16.5% |
| Nigeria | 16.4% |
| Kenya | 16.3% |
EXPLORE THE DATA
Compare any two countries.
Choose two places to inspect this indicator side-by-side. Same source, same year.
VS