← All visual stories
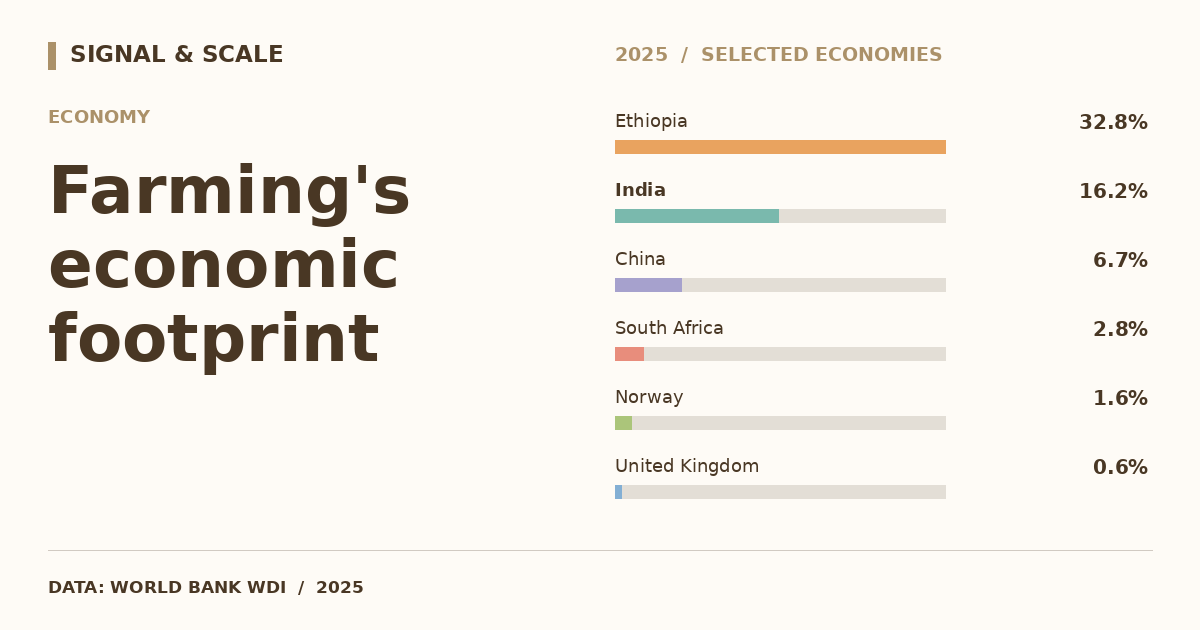
Farming's economic footprint
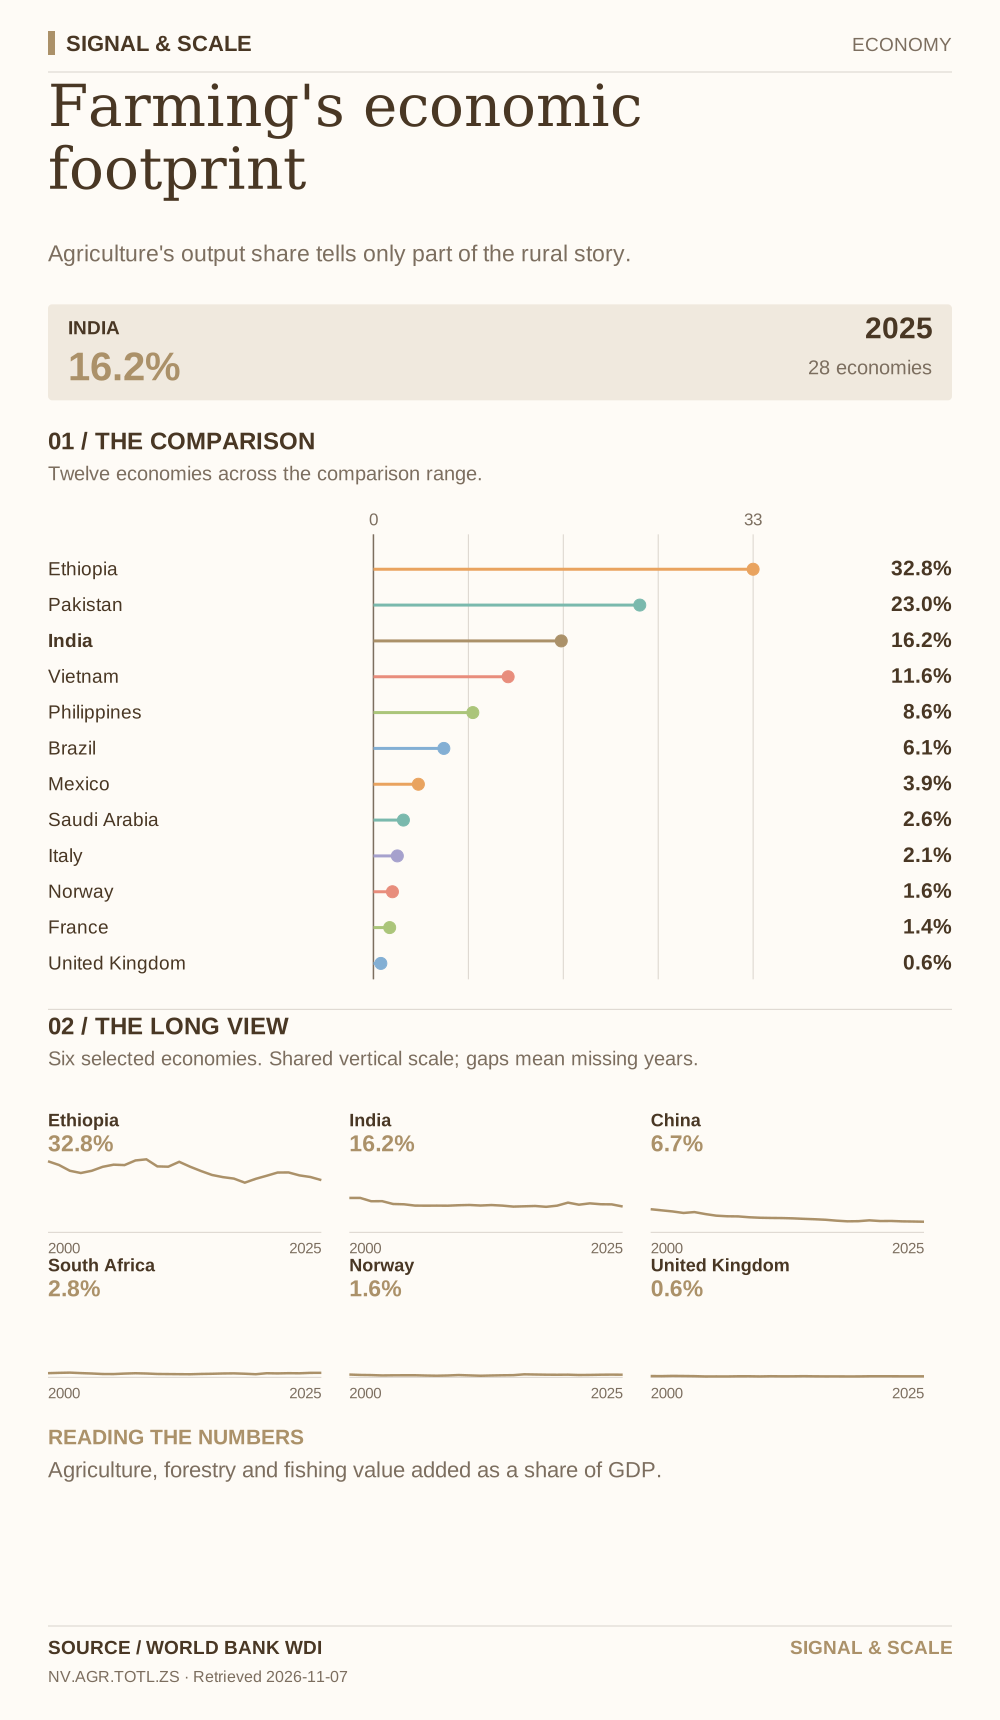
Agriculture's output share tells only part of the rural story.

Explore, download and share
THE STORY BEHIND THE CHART
The story behind the numbers
Agriculture, forestry and fishing remain central to livelihoods in many economies. Their share of GDP does not equal their share of employment, and a low GDP share can coexist with high agricultural productivity. Weather and commodity prices can influence annual observations.
THE TAKEAWAY
Agriculture's output share tells only part of the rural story.
Read the numbers carefully
Agriculture, forestry and fishing value added as a share of GDP.
Data behind the visual
This selected comparison includes 28 economies with observations in 2025 shown in % of GDP.
| Country | Value |
|---|---|
| Ethiopia | 32.8% |
| Kenya | 23.2% |
| Pakistan | 23% |
| Nigeria | 23% |
| Egypt | 16.6% |
| India | 16.2% |
| Indonesia | 13.1% |
| Vietnam | 11.6% |
| Bangladesh | 11.4% |
| Thailand | 8.7% |
| Philippines | 8.6% |
| China | 6.7% |
| Brazil | 6.1% |
| Argentina | 5.5% |
| Türkiye | 5.2% |
| Mexico | 3.9% |
| South Africa | 2.8% |
| Saudi Arabia | 2.6% |
| Poland | 2.5% |
| Australia | 2.3% |
| Italy | 2.1% |
| Netherlands | 1.7% |
| Norway | 1.6% |
| Sweden | 1.5% |
| South Korea | 1.5% |
| France | 1.4% |
| Germany | 0.9% |
| United Kingdom | 0.6% |
EXPLORE THE DATA
Compare any two countries.
Choose two places to inspect this indicator side-by-side. Same source, same year.
VS