← All visual stories
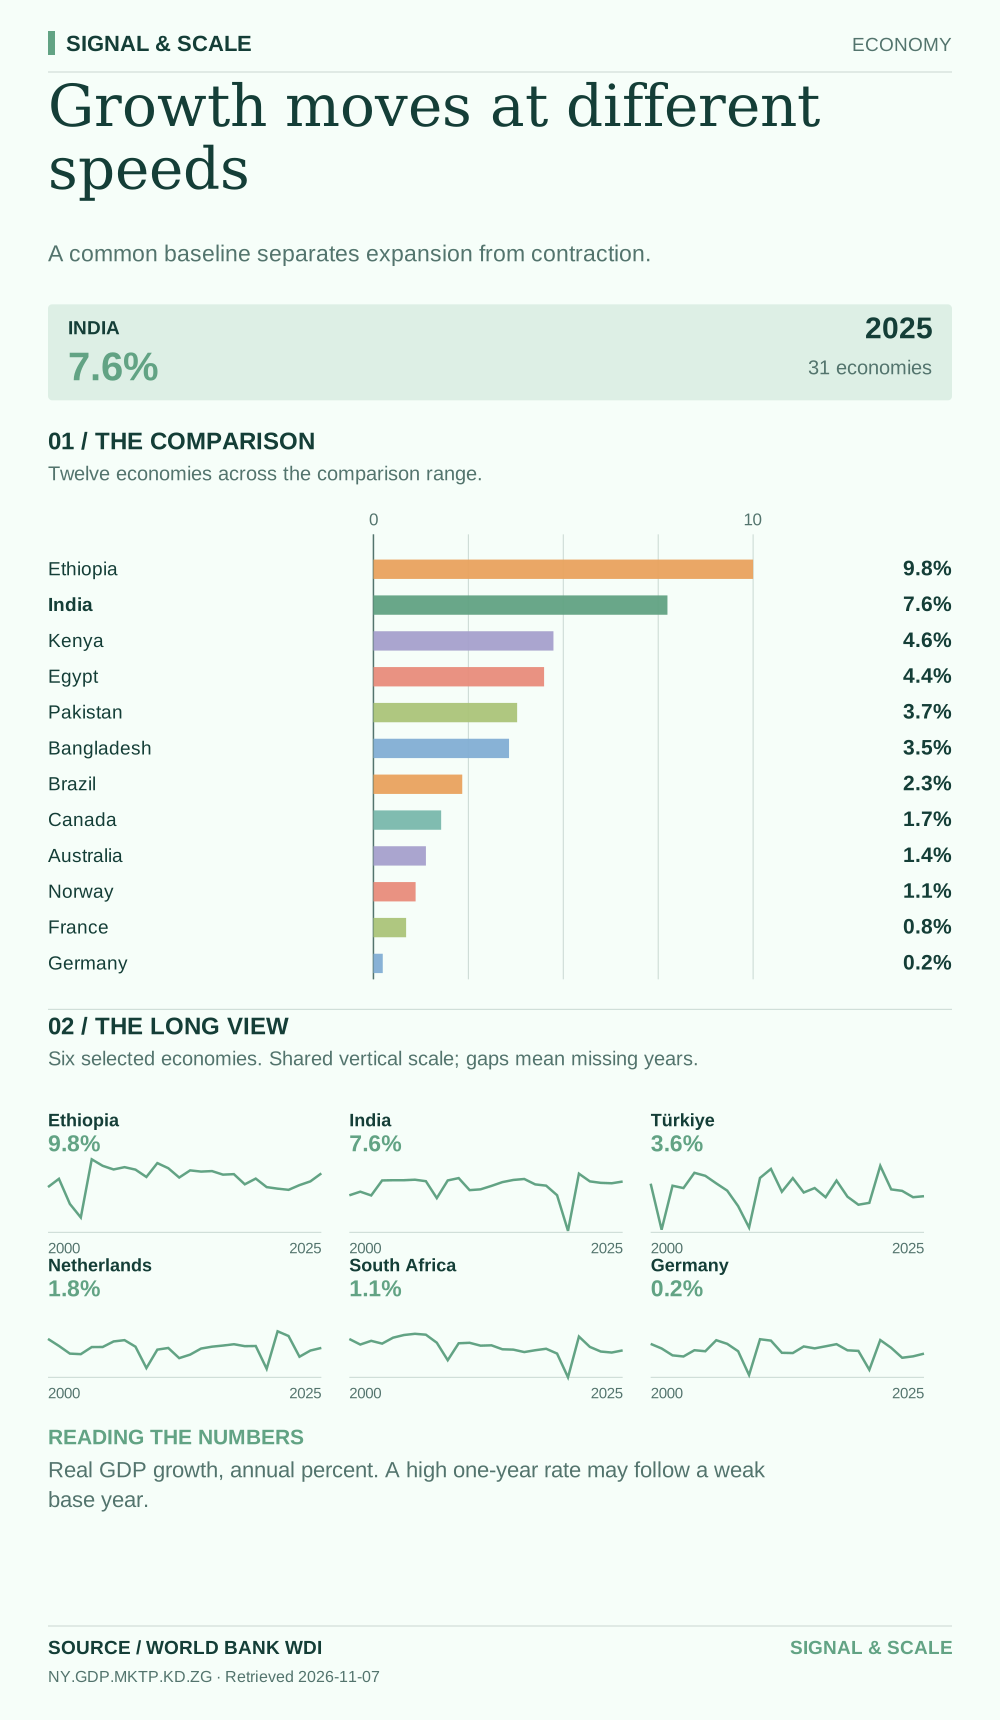
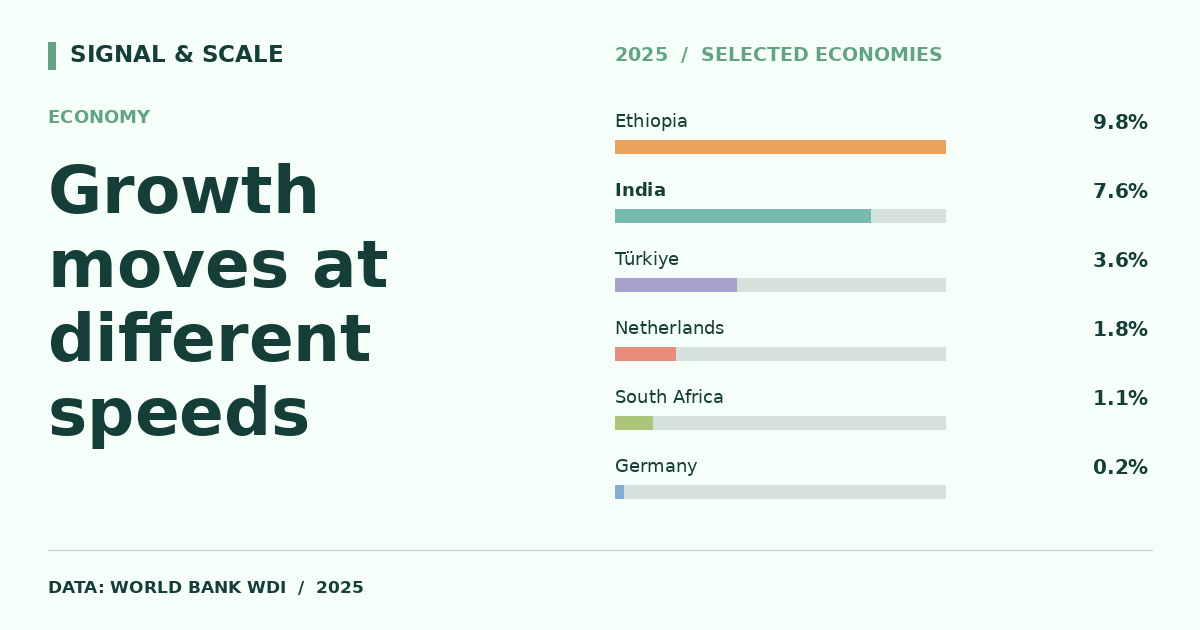
Growth moves at different speeds
A common baseline separates expansion from contraction.

Explore, download and share
THE STORY BEHIND THE CHART
The story behind the numbers
Annual real GDP growth measures changes in output after adjusting for price changes. The zero line is the dividing point between expansion and contraction. The historical panel places a single year's rate in context, including the sharp swings around economic shocks.
THE TAKEAWAY
A common baseline separates expansion from contraction.
Read the numbers carefully
Real GDP growth, annual percent. A high one-year rate may follow a weak base year.
Data behind the visual
This selected comparison includes 31 economies with observations in 2025 shown in % annual.
| Country | Value |
|---|---|
| Ethiopia | 9.8% |
| Vietnam | 8% |
| India | 7.6% |
| Indonesia | 5.1% |
| China | 5% |
| Kenya | 4.6% |
| Saudi Arabia | 4.5% |
| Philippines | 4.4% |
| Egypt | 4.4% |
| Argentina | 4.4% |
| Nigeria | 4% |
| Pakistan | 3.7% |
| Türkiye | 3.6% |
| Poland | 3.6% |
| Bangladesh | 3.5% |
| Thailand | 2.4% |
| Brazil | 2.3% |
| United States | 2.2% |
| Netherlands | 1.8% |
| Canada | 1.7% |
| Sweden | 1.5% |
| United Kingdom | 1.4% |
| Australia | 1.4% |
| Japan | 1.2% |
| South Africa | 1.1% |
| Norway | 1.1% |
| South Korea | 1% |
| France | 0.8% |
| Mexico | 0.6% |
| Italy | 0.5% |
| Germany | 0.2% |
EXPLORE THE DATA
Compare any two countries.
Choose two places to inspect this indicator side-by-side. Same source, same year.
VS