← All visual stories
Renewables beyond the power socket
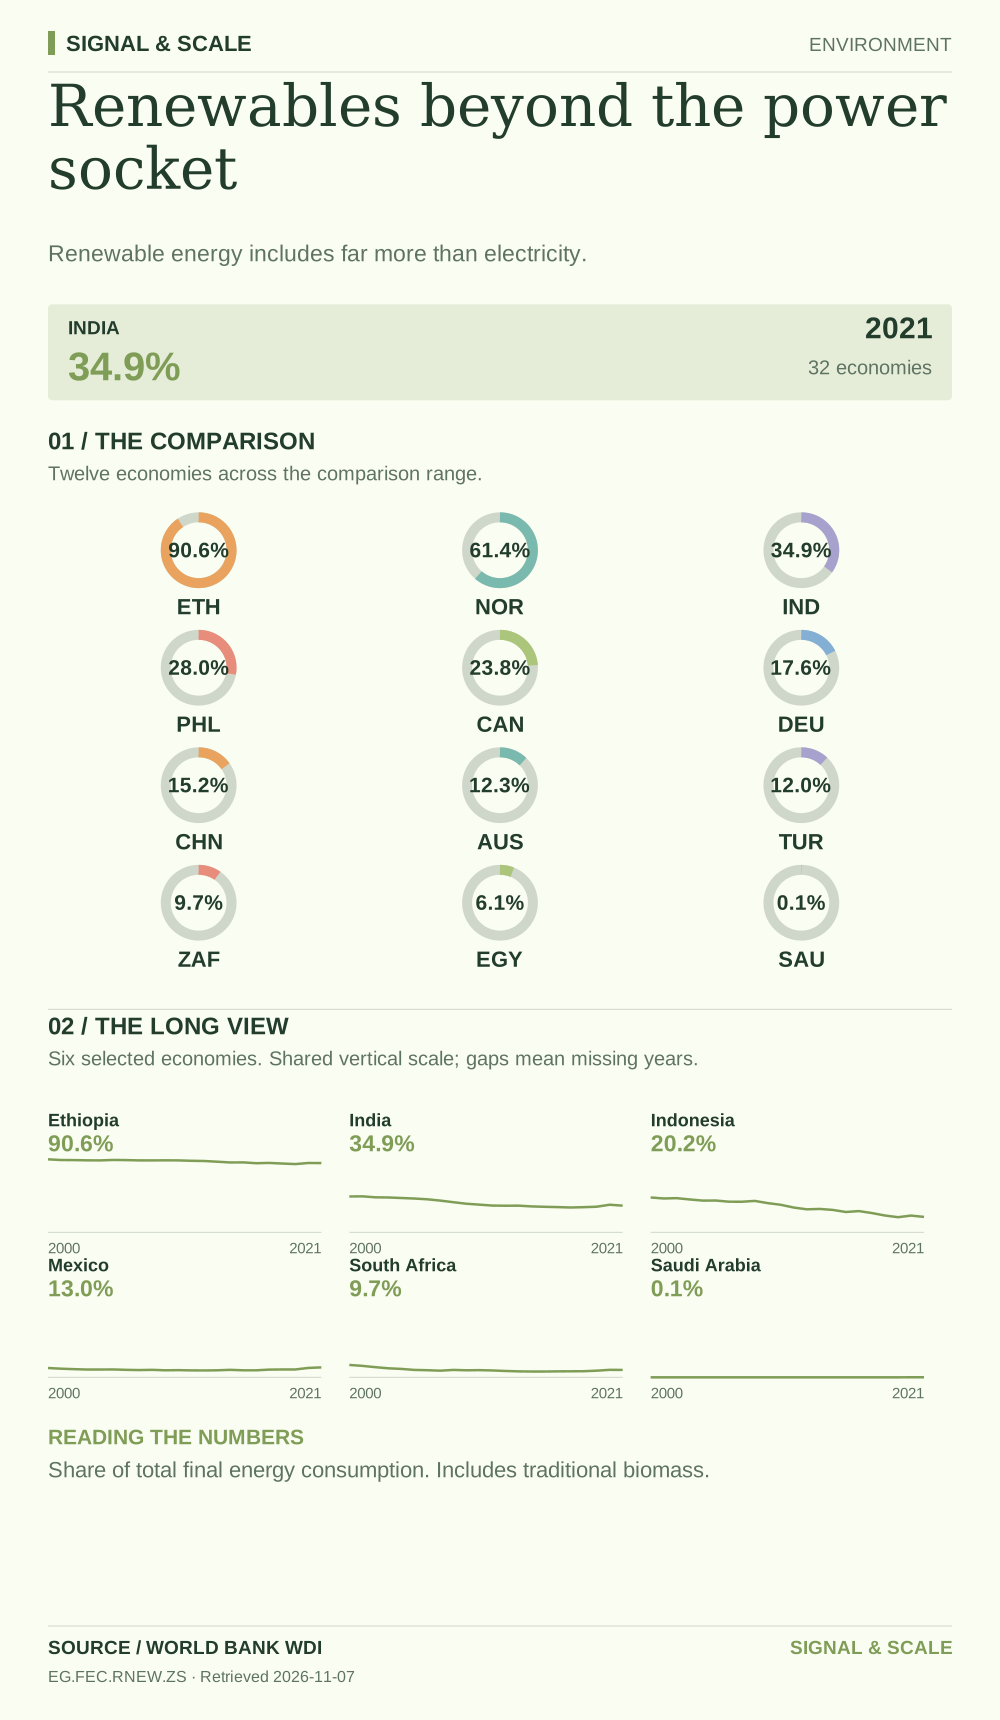
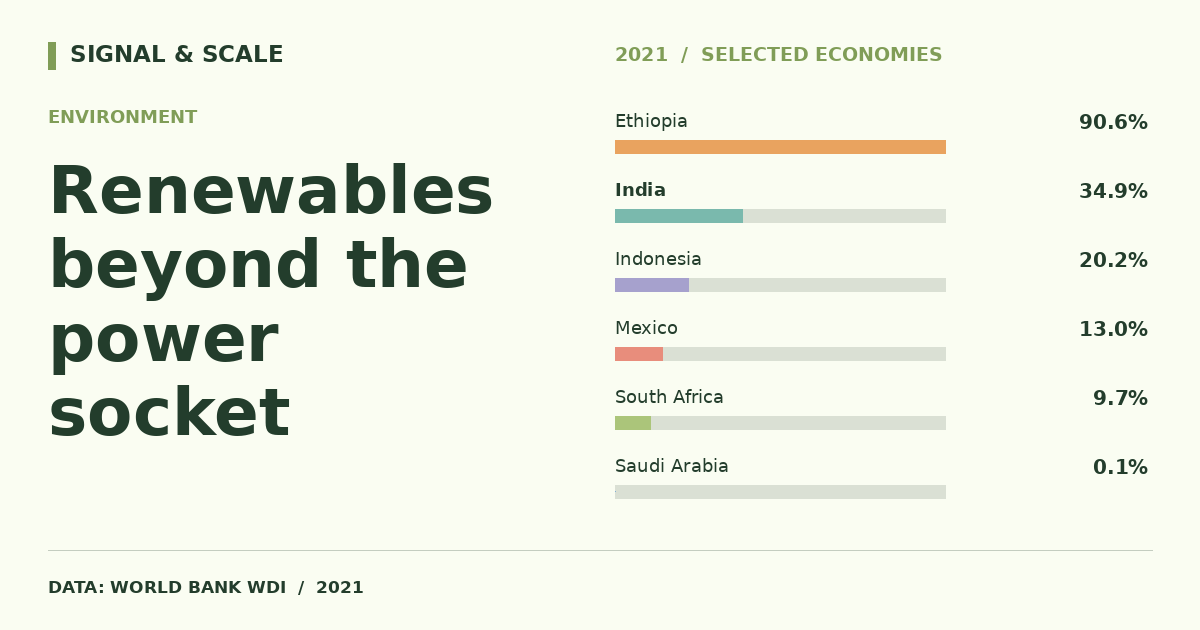
Renewable energy includes far more than electricity.

Explore, download and share
THE STORY BEHIND THE CHART
The story behind the numbers
This indicator measures renewables in total final energy consumption, including heat and transport. Traditional biomass can contribute substantially in lower-income economies. A high share therefore needs context about technologies, energy access and how energy is used.
THE TAKEAWAY
Renewable energy includes far more than electricity.
Read the numbers carefully
Share of total final energy consumption. Includes traditional biomass.
Data behind the visual
This selected comparison includes 32 economies with observations in 2021 shown in % of energy.
| Country | Value |
|---|---|
| Ethiopia | 90.6% |
| Nigeria | 80.3% |
| Kenya | 67.7% |
| Norway | 61.4% |
| Sweden | 57.9% |
| Brazil | 46.5% |
| Pakistan | 41.6% |
| India | 34.9% |
| Philippines | 28% |
| Bangladesh | 25% |
| Vietnam | 24.2% |
| Canada | 23.8% |
| Indonesia | 20.2% |
| Thailand | 19% |
| Germany | 17.6% |
| Italy | 17.5% |
| France | 16.2% |
| China | 15.2% |
| Poland | 15.2% |
| Mexico | 13% |
| Australia | 12.3% |
| Netherlands | 12.2% |
| United Kingdom | 12.2% |
| Türkiye | 12% |
| United States | 10.9% |
| South Africa | 9.7% |
| Argentina | 9.2% |
| Japan | 8.8% |
| Egypt | 6.1% |
| South Korea | 3.6% |
| United Arab Emirates | 1% |
| Saudi Arabia | 0.1% |
EXPLORE THE DATA
Compare any two countries.
Choose two places to inspect this indicator side-by-side. Same source, same year.
VS