← All visual stories
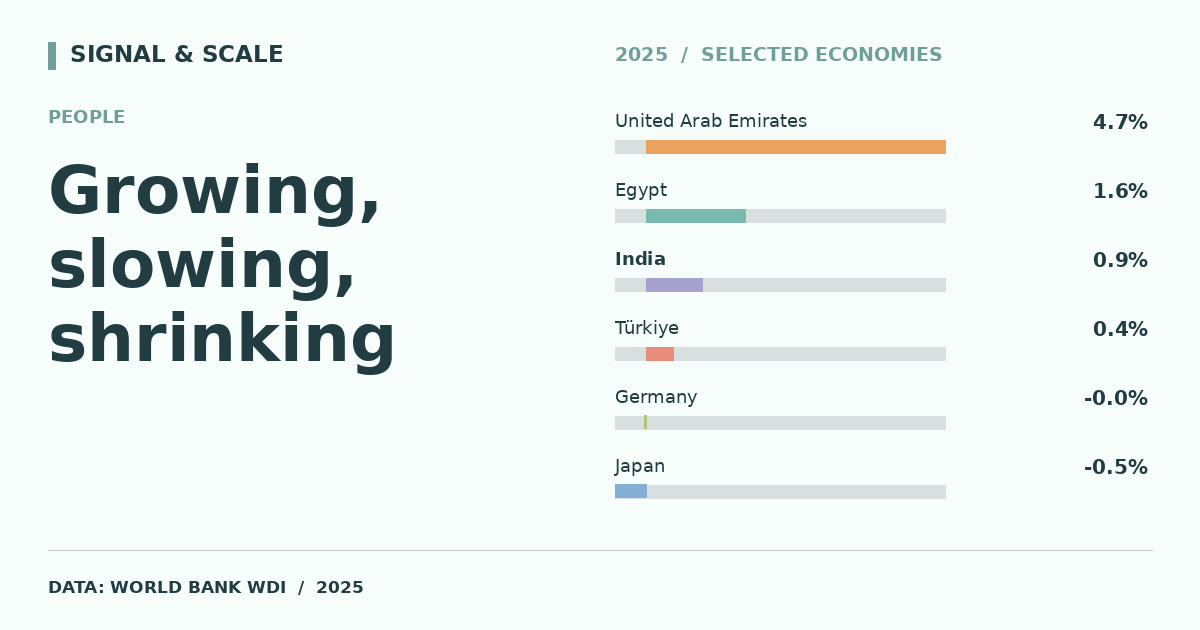
Growing, slowing, shrinking
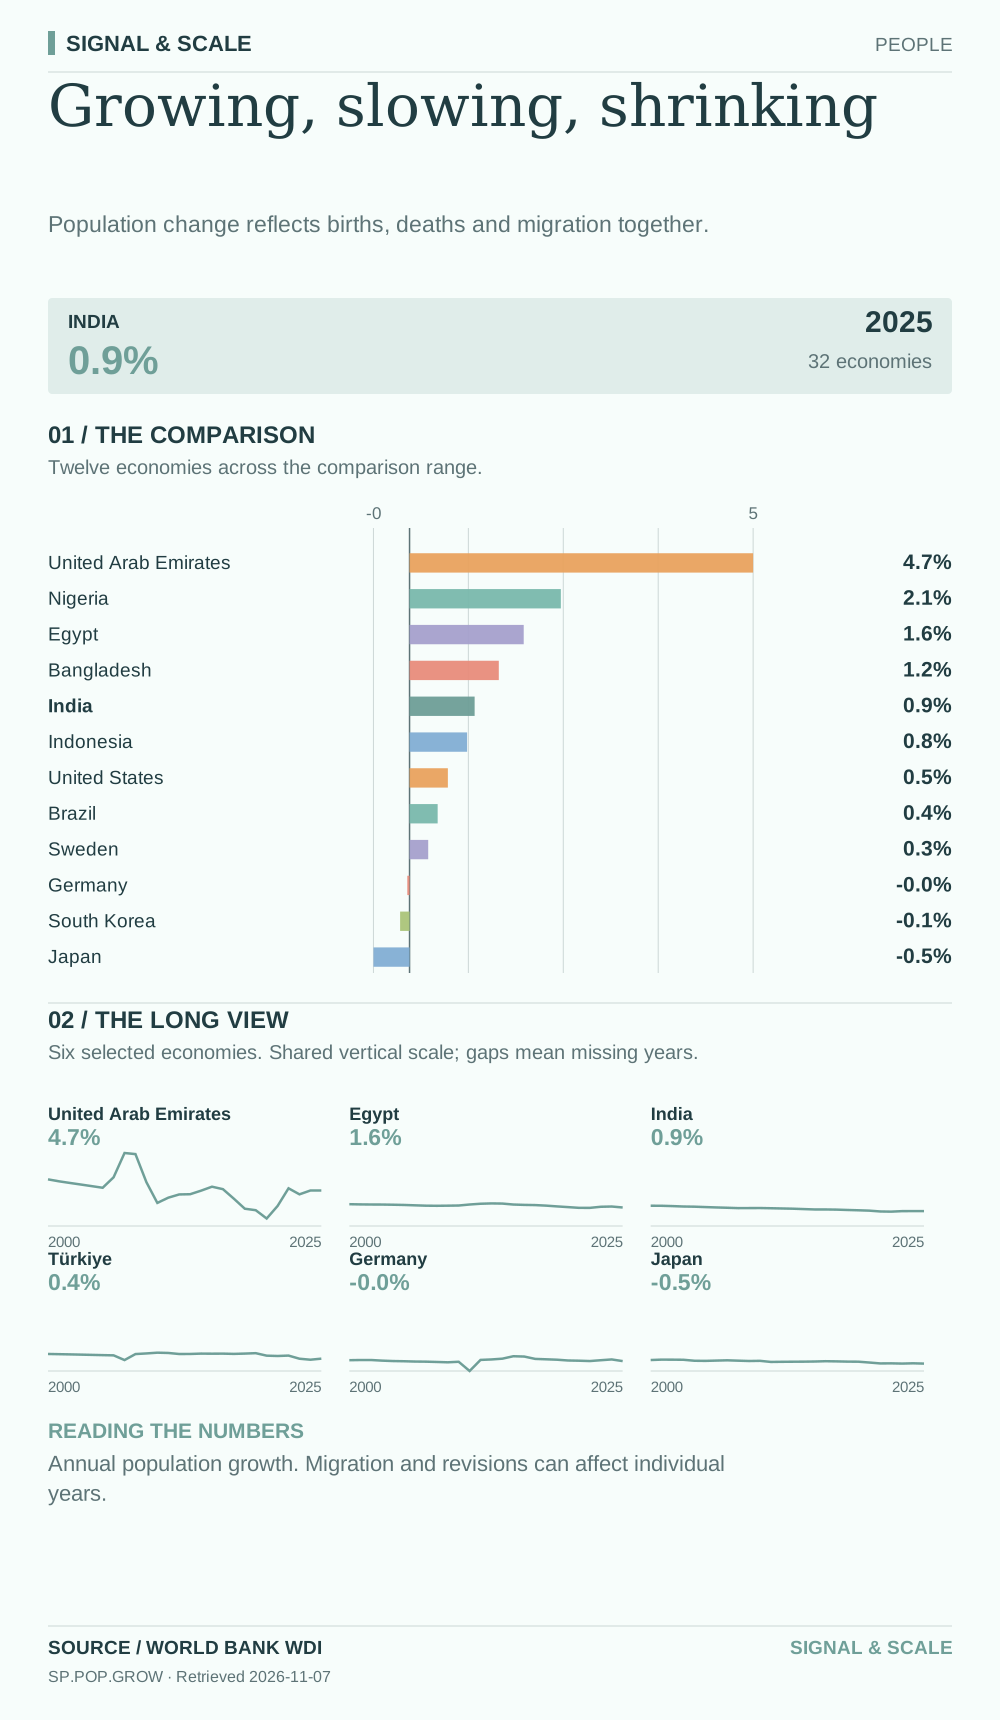
Population change reflects births, deaths and migration together.

Explore, download and share
THE STORY BEHIND THE CHART
The story behind the numbers
Annual population growth combines natural change with net migration and statistical revisions. A positive rate does not necessarily imply high fertility, and a negative rate does not identify its cause. The historical panel puts the latest estimate in a longer context.
THE TAKEAWAY
Population change reflects births, deaths and migration together.
Read the numbers carefully
Annual population growth. Migration and revisions can affect individual years.
Data behind the visual
This selected comparison includes 32 economies with observations in 2025 shown in % annual.
| Country | Value |
|---|---|
| United Arab Emirates | 4.7% |
| Saudi Arabia | 4.6% |
| Ethiopia | 2.6% |
| Nigeria | 2.1% |
| Kenya | 1.9% |
| Pakistan | 1.6% |
| Egypt | 1.6% |
| Australia | 1.5% |
| Bangladesh | 1.2% |
| South Africa | 1.1% |
| Canada | 0.9% |
| India | 0.9% |
| Mexico | 0.8% |
| Philippines | 0.8% |
| Indonesia | 0.8% |
| Norway | 0.7% |
| Vietnam | 0.6% |
| United States | 0.5% |
| Netherlands | 0.5% |
| Türkiye | 0.4% |
| Brazil | 0.4% |
| Argentina | 0.3% |
| United Kingdom | 0.3% |
| Sweden | 0.3% |
| France | 0.2% |
| Germany | -0% |
| Italy | -0.1% |
| Thailand | -0.1% |
| South Korea | -0.1% |
| China | -0.2% |
| Poland | -0.3% |
| Japan | -0.5% |
EXPLORE THE DATA
Compare any two countries.
Choose two places to inspect this indicator side-by-side. Same source, same year.
VS