← All visual stories
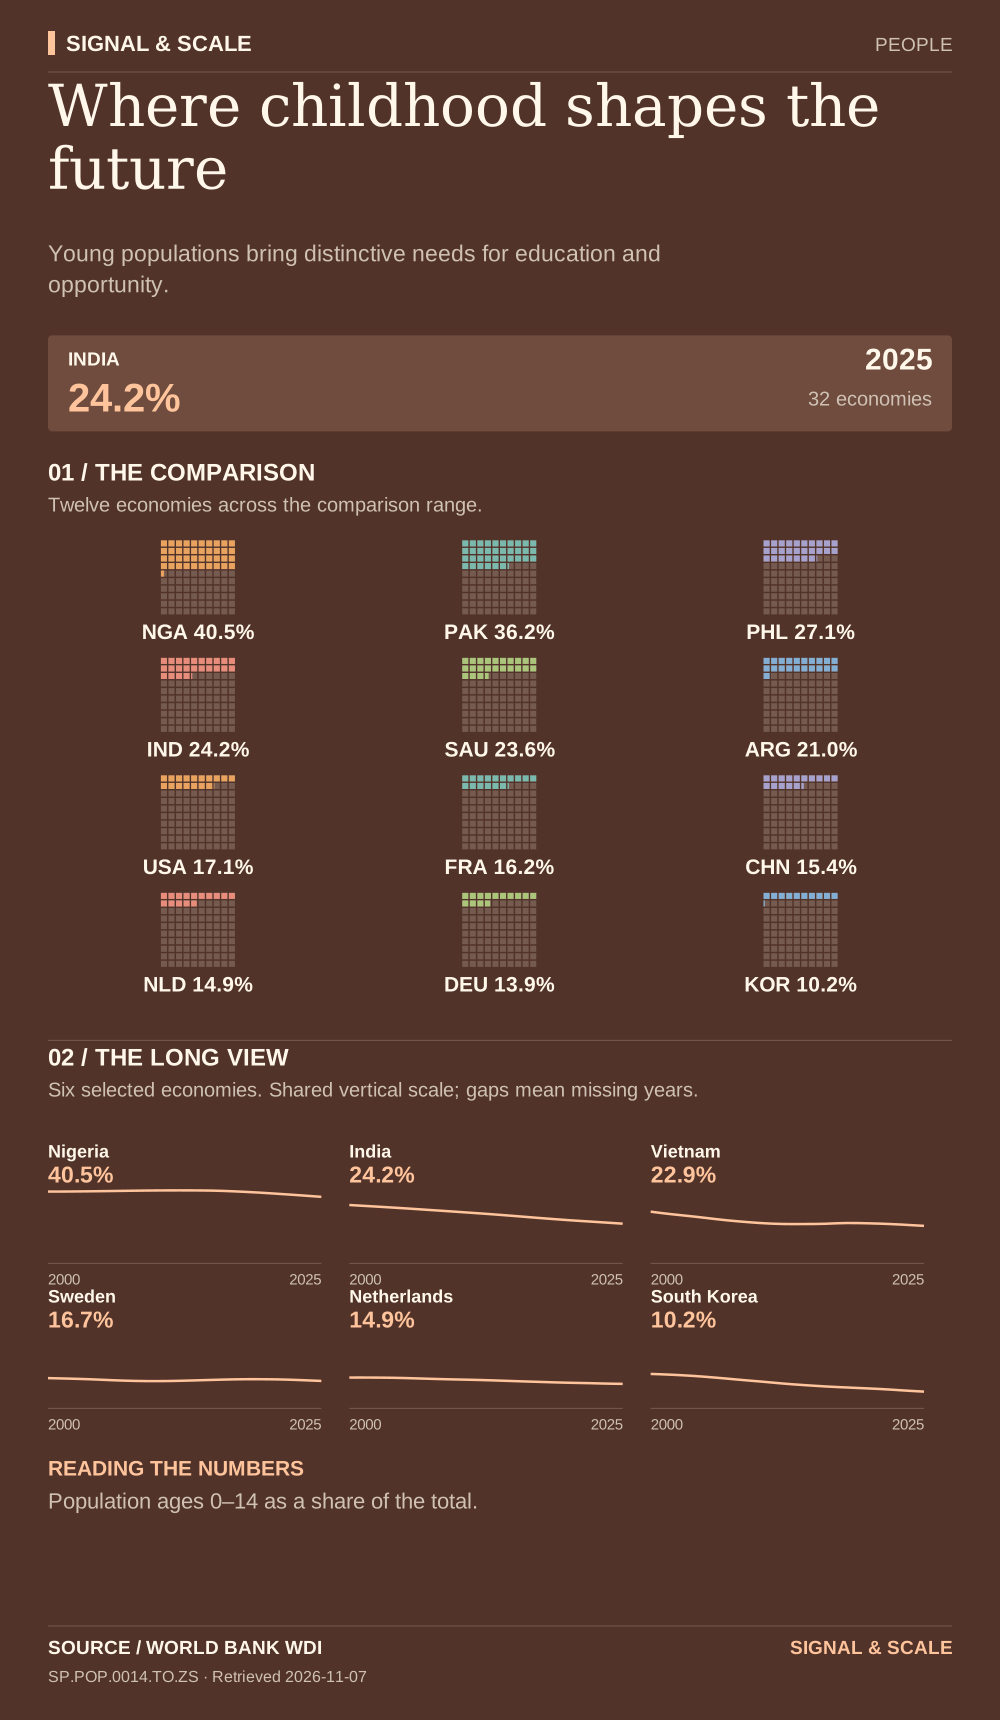
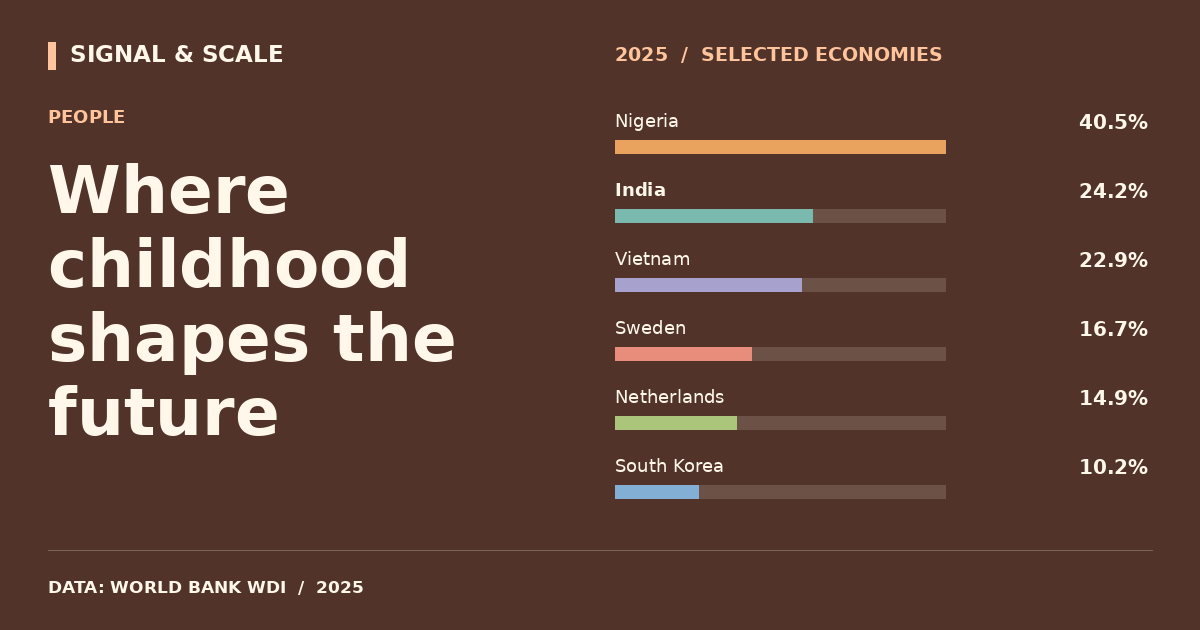
Where childhood shapes the future
Young populations bring distinctive needs for education and opportunity.

Explore, download and share
THE STORY BEHIND THE CHART
The story behind the numbers
The share of children under 15 indicates the scale of demand for schooling and pediatric services. A youthful age structure can later expand the working-age population, but economic outcomes depend on health, education and employment opportunities.
THE TAKEAWAY
Young populations bring distinctive needs for education and opportunity.
Read the numbers carefully
Population ages 0–14 as a share of the total.
Data behind the visual
This selected comparison includes 32 economies with observations in 2025 shown in % of people.
| Country | Value |
|---|---|
| Nigeria | 40.5% |
| Ethiopia | 38.8% |
| Kenya | 36.3% |
| Pakistan | 36.2% |
| Egypt | 31.6% |
| Bangladesh | 27.6% |
| Philippines | 27.1% |
| South Africa | 25.7% |
| Indonesia | 24.2% |
| India | 24.2% |
| Mexico | 24.1% |
| Saudi Arabia | 23.6% |
| Vietnam | 22.9% |
| Türkiye | 21% |
| Argentina | 21% |
| Brazil | 19.4% |
| Australia | 17.7% |
| United States | 17.1% |
| United Kingdom | 17% |
| Sweden | 16.7% |
| France | 16.2% |
| United Arab Emirates | 16% |
| Norway | 15.9% |
| China | 15.4% |
| Canada | 15% |
| Netherlands | 14.9% |
| Poland | 14.5% |
| Thailand | 14.4% |
| Germany | 13.9% |
| Italy | 11.7% |
| Japan | 11.2% |
| South Korea | 10.2% |
EXPLORE THE DATA
Compare any two countries.
Choose two places to inspect this indicator side-by-side. Same source, same year.
VS