← All visual stories
A lifetime of inequality
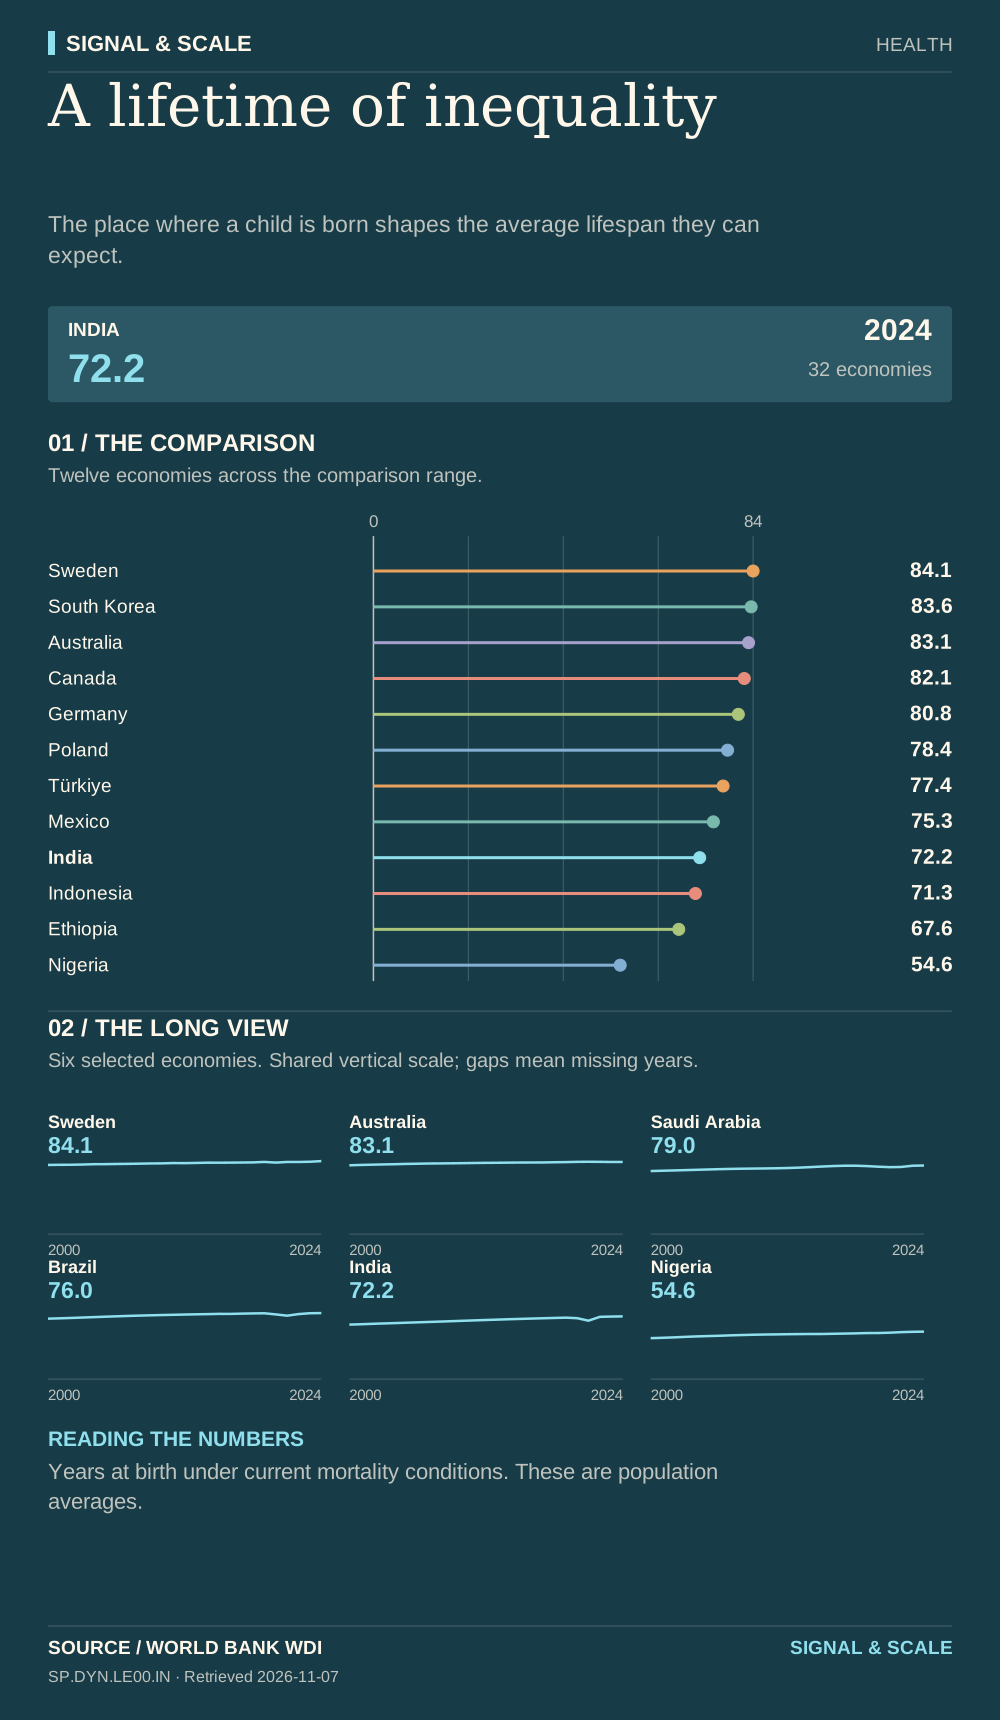
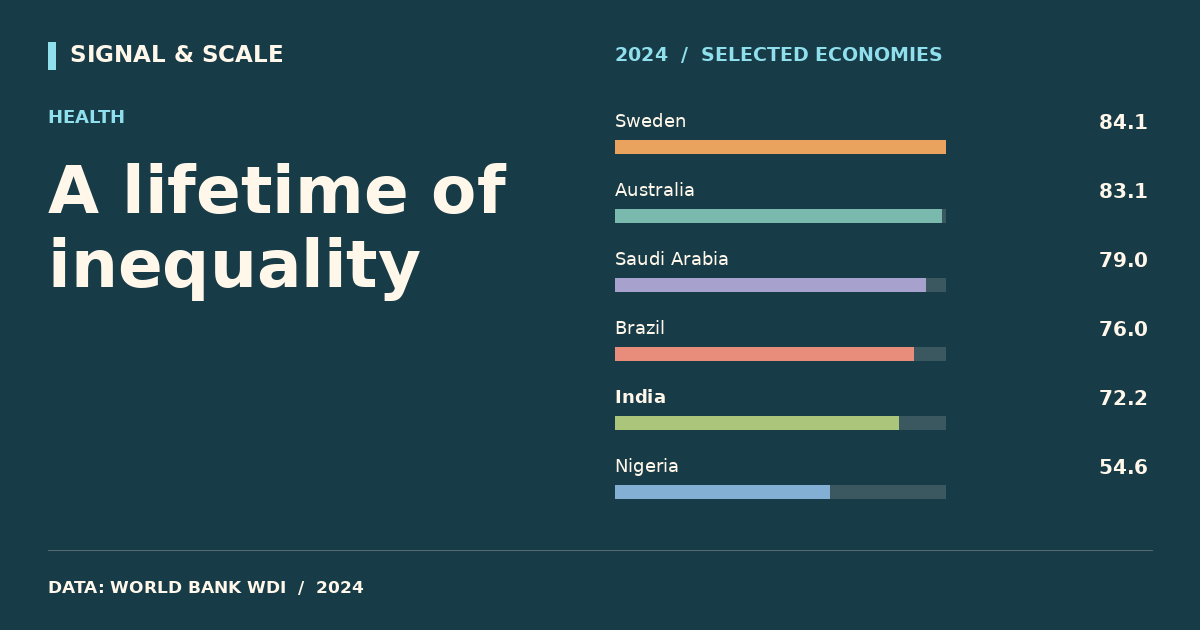
The place where a child is born shapes the average lifespan they can expect.

Explore, download and share
THE STORY BEHIND THE CHART
The story behind the numbers
Life expectancy at birth summarizes mortality conditions in a given year. It is a population measure rather than a forecast for an individual child. Long-run improvement can coexist with temporary reversals, which is why the historical panel matters alongside the latest ranking.
THE TAKEAWAY
The place where a child is born shapes the average lifespan they can expect.
Read the numbers carefully
Years at birth under current mortality conditions. These are population averages.
Data behind the visual
This selected comparison includes 32 economies with observations in 2024 shown in years.
| Country | Value |
|---|---|
| Sweden | 84.1 |
| Japan | 84 |
| Italy | 84 |
| South Korea | 83.6 |
| Norway | 83.2 |
| United Arab Emirates | 83.1 |
| Australia | 83.1 |
| France | 83 |
| Canada | 82.1 |
| Netherlands | 82 |
| United Kingdom | 81.4 |
| Germany | 80.8 |
| Saudi Arabia | 79 |
| United States | 78.9 |
| Poland | 78.4 |
| China | 78 |
| Argentina | 77.5 |
| Türkiye | 77.4 |
| Thailand | 76.6 |
| Brazil | 76 |
| Mexico | 75.3 |
| Bangladesh | 74.9 |
| Vietnam | 74.7 |
| India | 72.2 |
| Egypt | 71.8 |
| Indonesia | 71.3 |
| Philippines | 69.9 |
| Pakistan | 67.8 |
| Ethiopia | 67.6 |
| South Africa | 66.3 |
| Kenya | 63.8 |
| Nigeria | 54.6 |
EXPLORE THE DATA
Compare any two countries.
Choose two places to inspect this indicator side-by-side. Same source, same year.
VS