← All visual stories
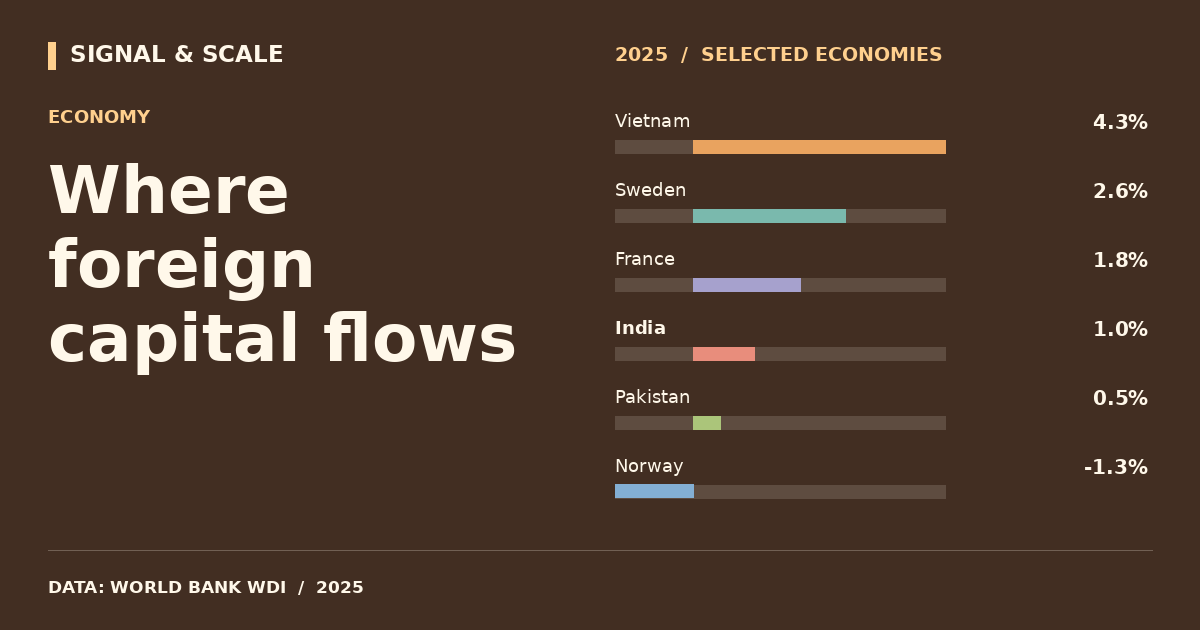
Where foreign capital flows
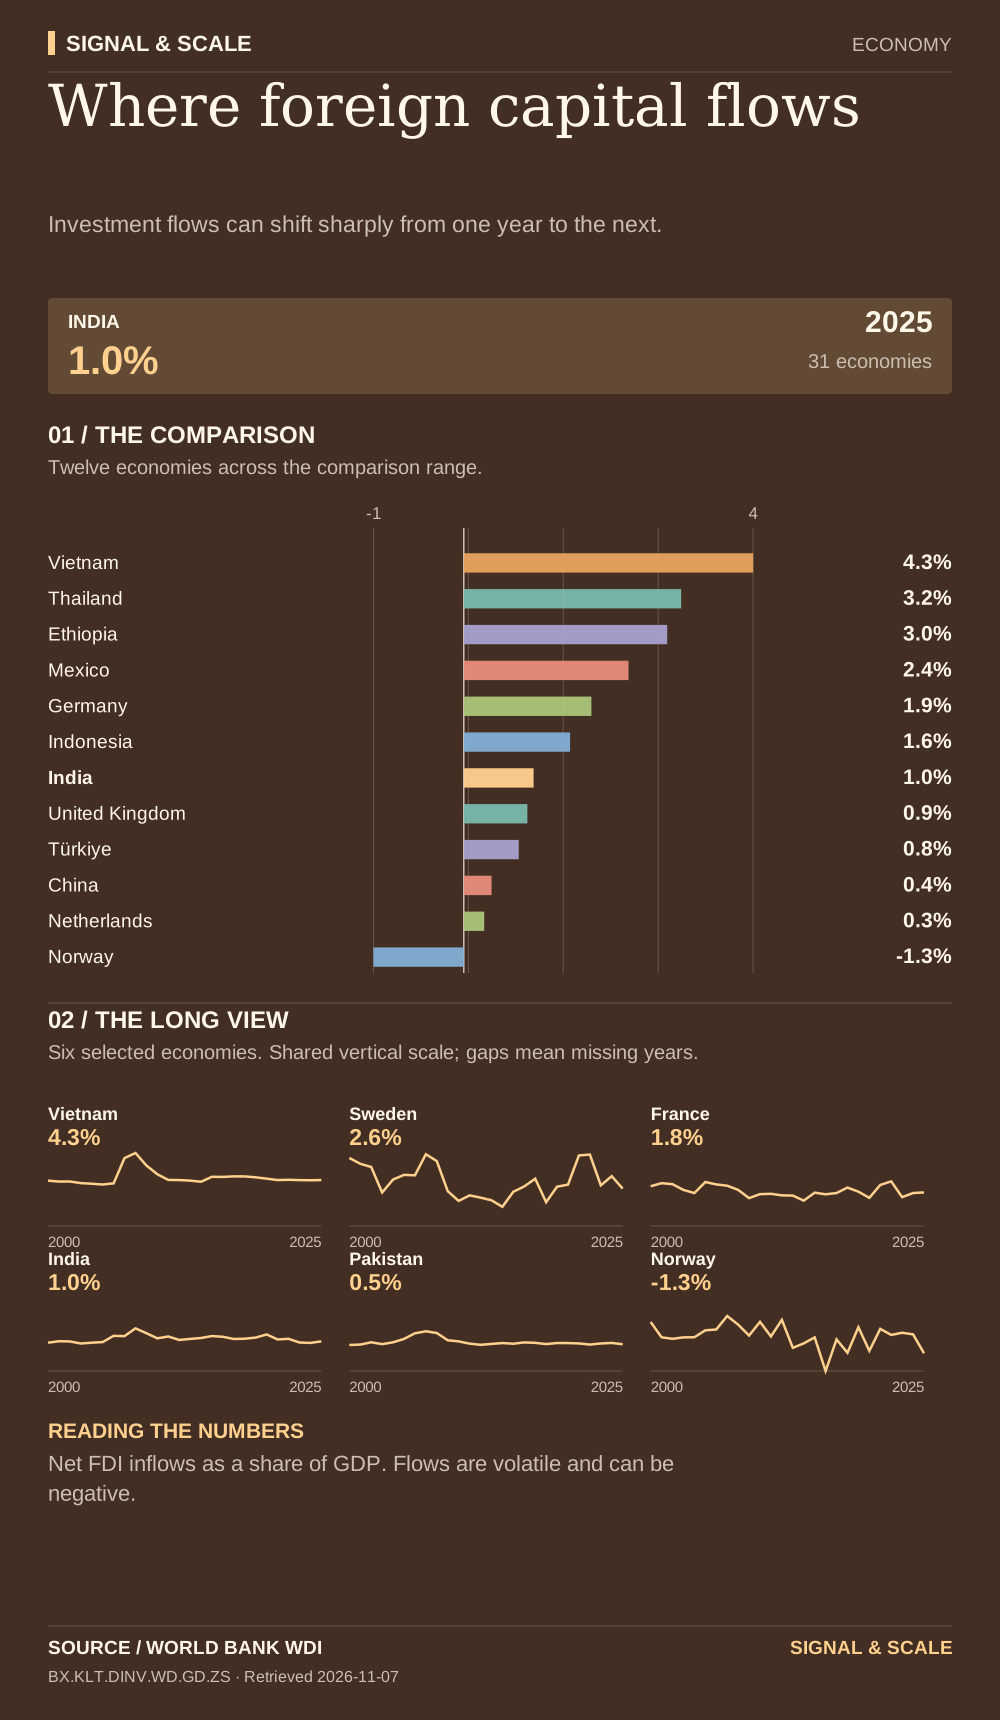
Investment flows can shift sharply from one year to the next.

Explore, download and share
THE STORY BEHIND THE CHART
The story behind the numbers
Foreign direct investment net inflows describe cross-border investment with a lasting management interest. The GDP ratio allows comparisons across economic sizes, but corporate restructuring and financial centers can produce large swings. Negative net inflows are possible.
THE TAKEAWAY
Investment flows can shift sharply from one year to the next.
Read the numbers carefully
Net FDI inflows as a share of GDP. Flows are volatile and can be negative.
Data behind the visual
This selected comparison includes 31 economies with observations in 2025 shown in % of GDP.
| Country | Value |
|---|---|
| Vietnam | 4.3% |
| Egypt | 4.2% |
| Brazil | 3.4% |
| Thailand | 3.2% |
| Canada | 3% |
| Ethiopia | 3% |
| Sweden | 2.6% |
| Saudi Arabia | 2.6% |
| Mexico | 2.4% |
| Australia | 2.1% |
| Poland | 2% |
| Germany | 1.9% |
| France | 1.8% |
| Philippines | 1.7% |
| Indonesia | 1.6% |
| Nigeria | 1.4% |
| Japan | 1% |
| India | 1% |
| United States | 1% |
| United Kingdom | 0.9% |
| South Korea | 0.8% |
| Kenya | 0.8% |
| Türkiye | 0.8% |
| Argentina | 0.6% |
| Pakistan | 0.5% |
| China | 0.4% |
| Bangladesh | 0.4% |
| Netherlands | 0.3% |
| Italy | 0% |
| South Africa | -0.5% |
| Norway | -1.3% |
EXPLORE THE DATA
Compare any two countries.
Choose two places to inspect this indicator side-by-side. Same source, same year.
VS